Figures & data
FIGURE 1. Screen capture of simulated driving environment. Participants used a steering wheel and gas or brake pedals to control the vehicle. They were instructed to keep their vehicle in the center of the right-most lane despite experiencing perturbations that induced heading changes.
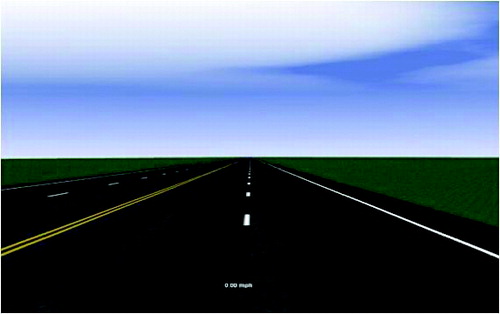
FIGURE 2. Example trial from a single subject to demonstrate the observed metrics. The x-axis is time in seconds. Time 0 refers to the onset of the perturbation that demarcated a trial. The steering wheel response magnitude (SWRM) was calculated as the difference in degrees between the circle and diamond. This was related to the value of the change in heading error at the time of response initiation (diamond, bottom subplot). square = when the perturbation was turned on; diamond = initiation of response; circle = peak of the steering wheel response.
FIGURE 3. Example regression fits for single subjects across in each time interval. Points in each block represent a single trial within that 5-min time interval. The slope of these regression lines was our independent variable, relative steering wheel compensation. dHE = derivative of heading error.
TABLE 1. Summary of Two-Way Analysis of Variance Design Results
FIGURE 4. Graphical representation of the variables of interest. Each subplot demonstrates the time course for each of the measures examined in this study. Vertical dashed lines represent the blocks in which subjects were interrupted to assess Karolinska Sleepiness Scale values and served as our block factor. The axes are the 5-min time interval factor in our analysis of variance design. Within each block the time factor level was 1, 2, 3. Please note that there are a total of nine time intervals for a total of 45 min. Error bars represent standard errors of the mean. The gray lines are the regression analysis over the entire 45-min duration of the experiment. RSWC = relative steering wheel compensation; LD = lane derivation; dHE = derivative of heading error; SWRM = steering wheel response magnitude.
TABLE 2. Regression Over Experiment Time
FIGURE 5. The variance accounted for in the steering wheel response magnitude (SWRM) by derivative of heading error across subjects for all time points in the study. The time factor in our analysis of variance design was significant across subjects, as was the linear regression (gray) over time.
FIGURE 6. For each regression computed in the study (EquationEquation 1(1) ) we plot the R2 and relative steering wheel compensation (RSWC) derived from that model. There was a high correlation between the two parameters, and a power curve fit (EquationEquation 2
(2) ) was significant (gray).