Figures & data
Figure 1. (A) Time course of the study. (B) Time course of one study session. JTT – Jebsen–Taylor Hand function test.
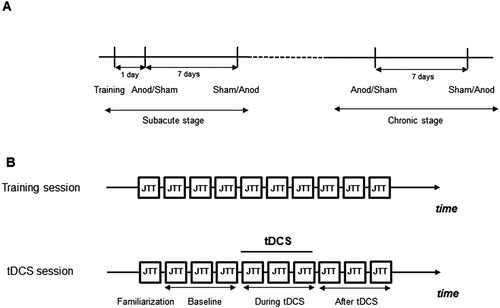
Figure 2. The mean total time of Jebsen–Taylor Hand function test during ten sessions of training. - mean, vertical bars denote 0.95 confidence intervals.
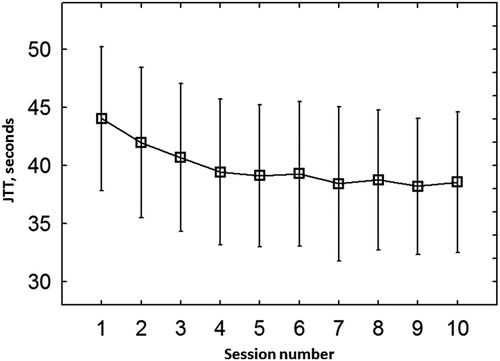
TABLE 1. Clinical characteristics of the patients.
Figure 3. Inverted mean percent change of the total JTT time relative to baseline (positive values represent improved performance). Significant interaction between type of stimulation, stage of stroke and time of the test performance was observed (repeated-measure ANOVA, F(1,12) = 7.39, p = 0.02). Relevant post-hoc comparisons (Fisher LSD test) are shown. * p < 0.05. **p < 0.01, ***p < 0.001.
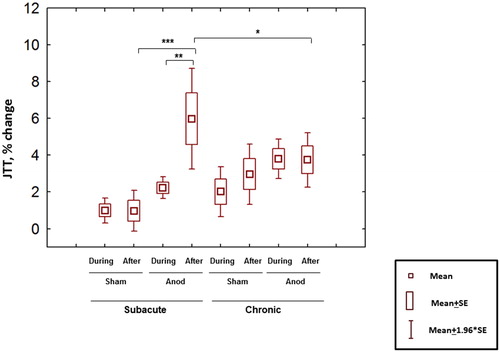
TABLE 2. Results of ANOVA.
TABLE 3. Mean time and percent of improvement of the subtests performance in different conditions.
Figure 4. Inverted percent change of the total JTT time relative to baseline (positive values represent improved performance) in individual patients (eight measurements with JTT in four sessions).
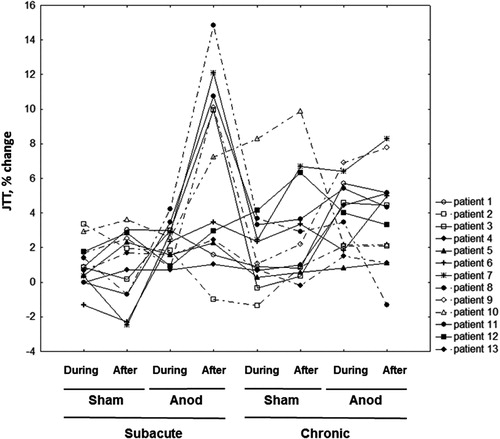
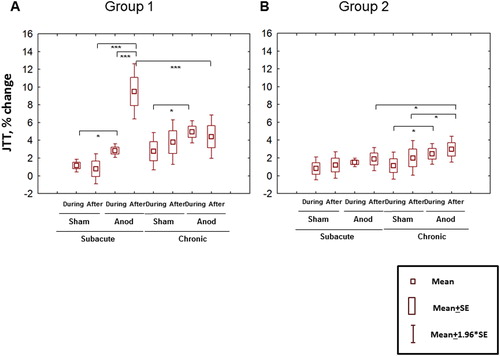
Figure 5. Inverted mean percent change of the total JTT time relative to baseline in Group 1 (A) and Group 2 (B). Repeated-measure ANOVA with factors STAGE, TYPE; TIME and GROUP (F(1,11) = 35.4; p = 0.0001). Relevant post-hoc comparisons (Fisher LSD test) are shown. *p < 0.05. **p < 0.01, ***p < 0.001.