
Figures & data
Figure 1. Illustration of the trial sequence in the visuomotor task. Participants tracked the path of a black ball (with a 50 pixels radius, moving with a speed of 5 pixels per 16 milliseconds) that “bounced” around a 1366 cm cm wide by 768 cm long screen. Whenever the ball reached either the top, bottom, left or right corners of the screen, this was marked as a trial, and it would bounce back toward the opposite direction. Neither the ball nor participants’ movements left a trail. In 1 out of 10 trials, the ball would turn red (e.g., bottom middle panel) and remain still for one second. During this time, participants had to click on the red “oddball” as quickly and accurately as possible.
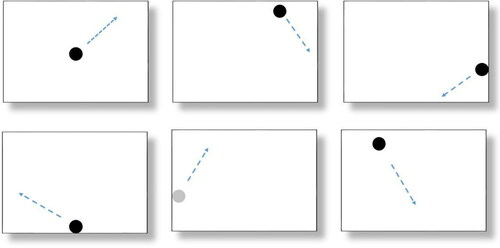
TABLE 2. Unstandardized means and standard deviations of mouse tracking features for each class – Focused attention and Mind wandering (N = 43).
Figure 2. Sample trajectory of one participant across 3 trials. The straight, faded lines represent the trajectory of the ball, while the uneven lines represents the trajectory of the participant.
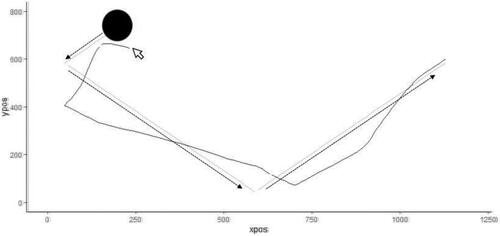
Figure 3. Mind wandering rates (Mean + SD) across blocks.
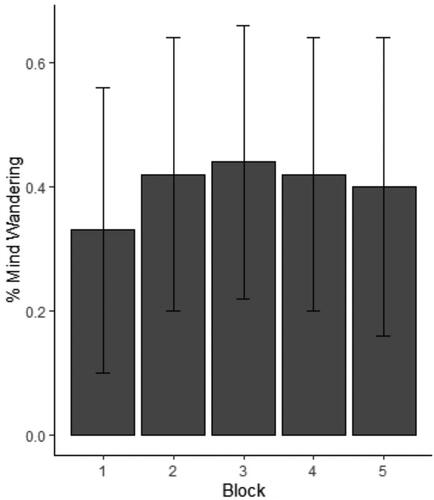
TABLE 3. Performance metrics for predicting mind wandering for multiple models on data using 17 mouse tracking features () and tracking accuracy per trial.
Figure 4. Tracking accuracy per block and per Mental State (FA – Focused Attention, MW – Mind Wandering, N = 37).
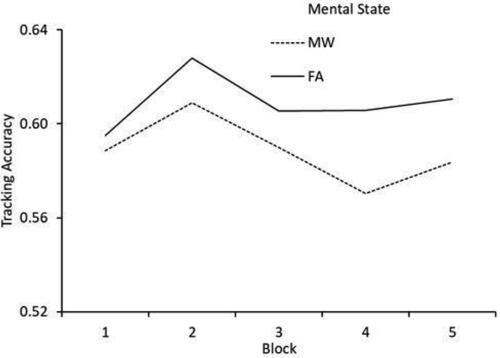
Figure 5. Sample movement intermittency of one trajectory in terms of acceleration (pixels/ms2). The dashed line represents the acceleration of the moving ball – which at a constant velocity, was 0.
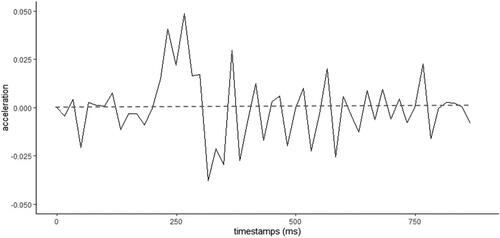
TABLE 1. Perceptual decoupling, mental navigation and content variation as predictors for tracking accuracy, intermittency, and velocity variability.
Data Availability Statement
The data that support the findings of this study are openly available in https://doi.org/10.34894/VZSY1L.