Figures & data
Figure 1. A conceptual diagram of the canonical correlation analysis using the canonical correlation between set 1 and set 3 as an example.
ML: medio-lateral, AP: anterio-posterior, Df: fractal dimension.
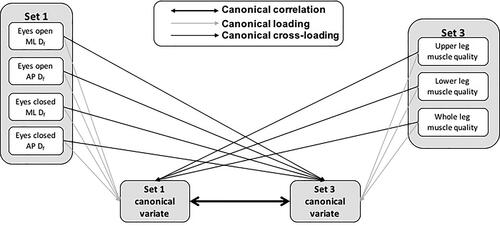
TABLE 1. Canonical loadings and cross-loadings for the first canonical function of the postural sway complexity and muscle quality canonical variates.
Figure 2. Mean and standard deviation values of (a) sway length, (b) sway area, (c) medio-lateral (ML) fractal dimension, and (d) anterio-posterior (AP) fractal dimension for the high muscle quality and low muscle quality groups and the whole study population.
* indicates that eyes closed is greater than eyes open, † indicates high muscle quality group is greater than low muscle quality group.
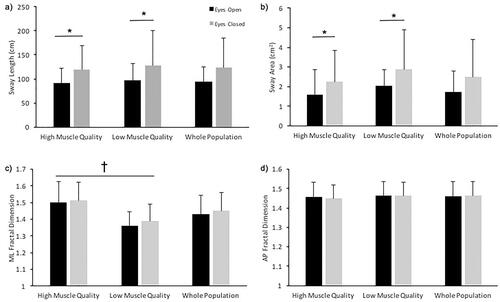
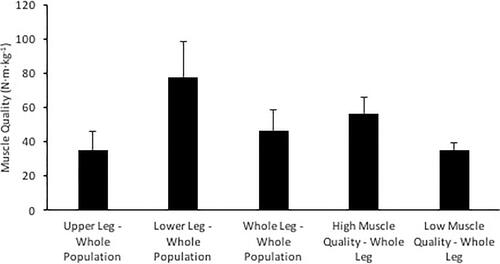
Figure 3. Mean and standard deviation values of upper, lower, and whole leg muscle quality and the whole leg muscle quality of the high and low muscle quality groups.