Figures & data
FIGURE 1. Time course of the two experimental sessions. The order of delivery of PNS and TMS was randomised across sessions and participants.
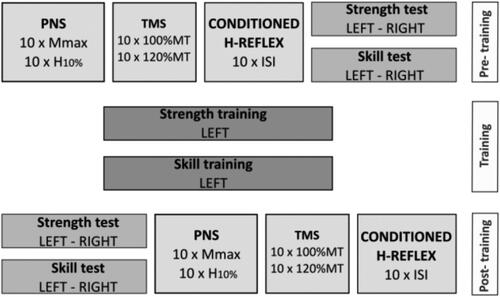
TABLE 1. Means and standard deviations of the parameters measured during strength and skill testing.
FIGURE 2. Results from peripheral nerve stimulation. (A) Mmax (n = 12) and (B) HM10% (n = 13) mean amplitudes recorded before (PRE) and after (POST) strength and skill training. Boxes represent the associated standard error (SE) and whiskers represent the associated 95% confidence interval.
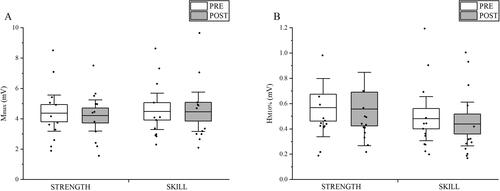
TABLE 2. Means and standard deviations (in mV) of the parameters recorded across time and conditions.
FIGURE 3. Results from TMS. (A) aMT (n = 13) and (B) 120% aMT (n = 10) mean amplitudes recorded before (PRE) and after (POST) strength and skill training. Boxes represent the associated standard error (SE) and whiskers represent the associated 95% confidence interval. The asterisks represent the significant effect of Time.
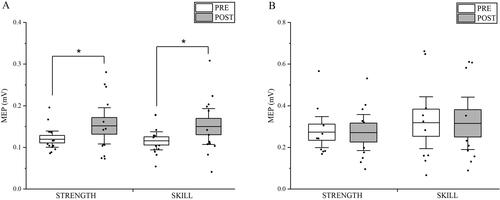
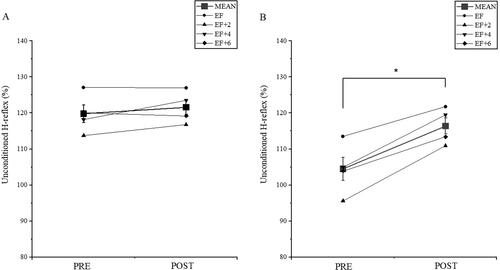
FIGURE 4. Mean conditioned H-reflex values (± SE) of all intervals across time for the (A) strength and (B) skill conditions as percentages of the unconditioned H-reflex). The asterisk represents a significant main effect of Time (p < 0.05).