Figures & data
Figure 1. Fuel rod distribution in the 9 × 9 MOX assembly [Citation5].
![Figure 1. Fuel rod distribution in the 9 × 9 MOX assembly [Citation5].](/cms/asset/acb00b47-9eb8-4f53-87d7-8fefc200b7c8/tnst_a_649075_o_f0001g.gif)
Figure 2. Axial burnup distribution of the H14 (T) rod and axial position of sample for chemical assay [Citation5].
![Figure 2. Axial burnup distribution of the H14 (T) rod and axial position of sample for chemical assay [Citation5].](/cms/asset/e44a8324-4f9e-4fa5-9131-63f43b65eb9f/tnst_a_649075_o_f0002g.gif)
Figure 3. Rod configuration of the irradiated GUN MOX bundle [Citation5].
![Figure 3. Rod configuration of the irradiated GUN MOX bundle [Citation5].](/cms/asset/5e7c95b5-7758-4de6-8a10-85c223bac975/tnst_a_649075_o_f0003g.gif)
Figure 4. Configuration of the irradiated GUN MOX core [Citation2].
![Figure 4. Configuration of the irradiated GUN MOX core [Citation2].](/cms/asset/9f1131d9-6c92-4e6b-9f86-1c95d6f5bac9/tnst_a_649075_o_f0004g.gif)
Figure 5. Core axial height configuration of the irradiated GUN MOX core [Citation5].
![Figure 5. Core axial height configuration of the irradiated GUN MOX core [Citation5].](/cms/asset/066de57c-90f5-45db-a9da-7ef93ac7b6a9/tnst_a_649075_o_f0005g.gif)
Figure 6. Measurement points of fission rate and activation rate distributions for the irradiated MOX core [Citation2].
![Figure 6. Measurement points of fission rate and activation rate distributions for the irradiated MOX core [Citation2].](/cms/asset/266ff481-4dac-42cb-9fb6-b9e0b316de4b/tnst_a_649075_o_f0006g.gif)
Figure 7. Geometrical and material model in inventory calculations of the MOX assembly.
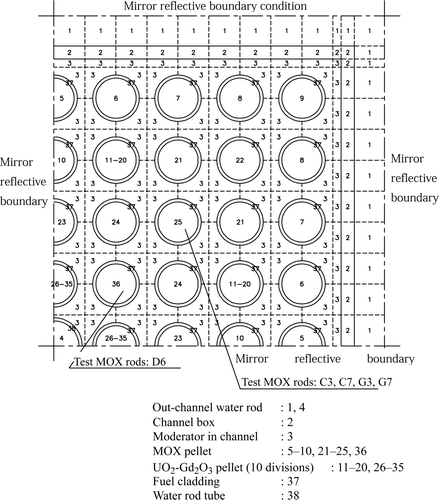
Figure 8. Relative contribution to total fissions from major actinides in the first region of H15 (B).
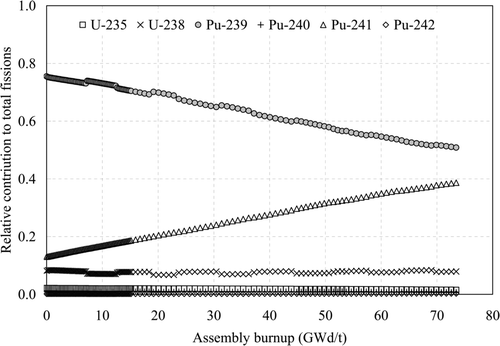
Figure 9. Calculated actinide inventories before irradiation and those after irradiation before cooling in the 2nd region of H14 (T).
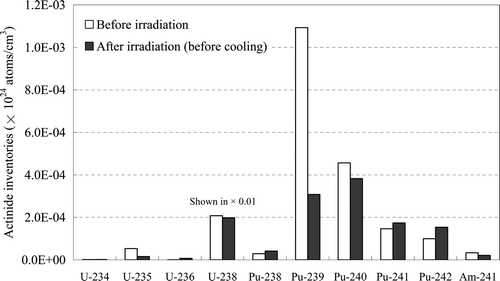
Figure 10. Ratio (C/E) of calculated to measured isotopic inventories in mg/gU-238 for a sample taken from H14 (T) [Citation4].
![Figure 10. Ratio (C/E) of calculated to measured isotopic inventories in mg/gU-238 for a sample taken from H14 (T) [Citation4].](/cms/asset/d67c7578-3af6-4748-a5d4-9d87d887bb16/tnst_a_649075_o_f0010g.jpg)
Figure 11. Normalized measured fission rate distribution of the irradiated MOX core [Citation5].
![Figure 11. Normalized measured fission rate distribution of the irradiated MOX core [Citation5].](/cms/asset/8b6b41ac-2faf-4fb2-bb3a-e287d8e778a2/tnst_a_649075_o_f0011g.gif)
Figure 12. Relative differences between the calculated fission rate distribution of the SRAC-CITATION and the measurements for the irradiate MOX core as (calculation − measurement)/measurement in percent.
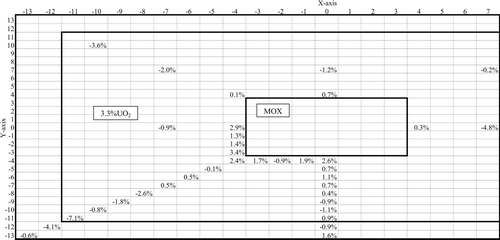
Figure 13. Relative fission rate distributions of the measurements and the calculations of SRAC-CITATION along Y axis at X = 0 for the irradiated MOX core.
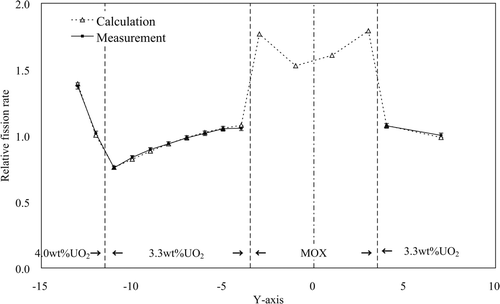
Figure 14. Cell models for calculation of in the irradiated MOX core.
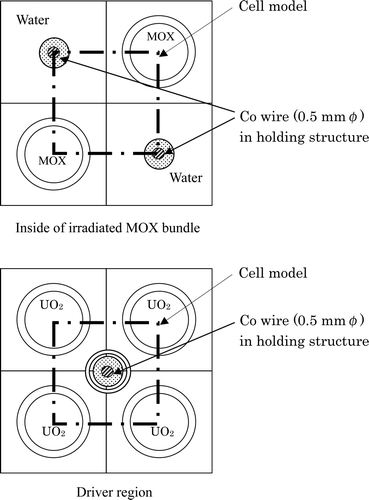
Figure 15. Normalized measured co-activation rate distribution of the irradiated MOX core.

Figure 16. Relative differences between the calculated co-activation rate distribution of the SRAC-CITATION and the measurements for the irradiated MOX core as (calculation − measurement)/measurement in percent.
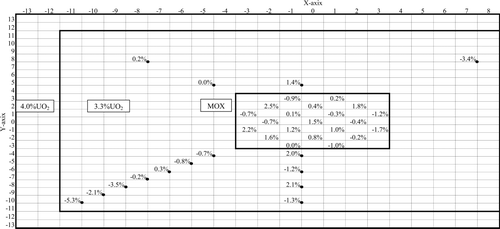
Figure 17. Relative co-activation rate distributions of the calculations of SRAC-CITATION and the measurements along a diagonal direction of the irradiated MOX core.
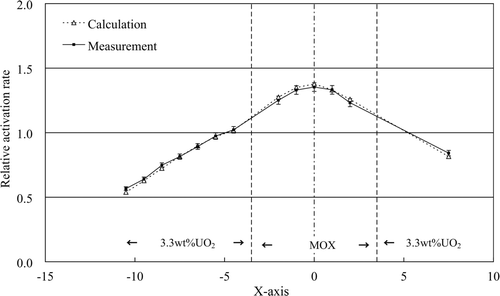
Figure 18. Principle of determination of burnup reactivity in the REBUS program.
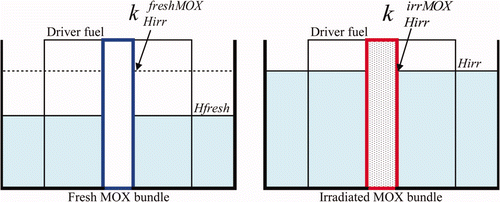
Figure 19. Contribution of each nuclide to k ∞ of a MOX cell of an axial region 2 of the test MOX rod of H14 (T) from corrections in isotopic inventories.
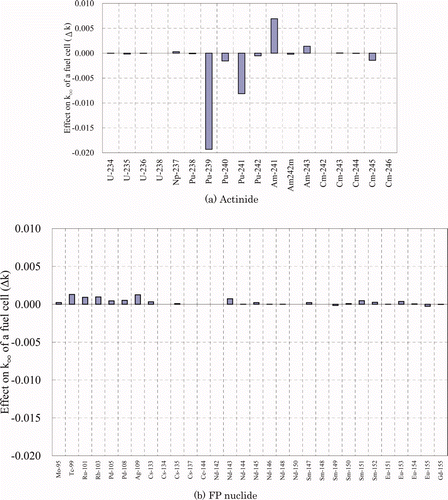
Figure 20. Measured and calculated burnup reactivity of the irradiated MOX bundle.
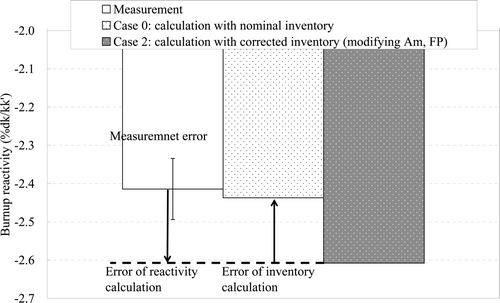
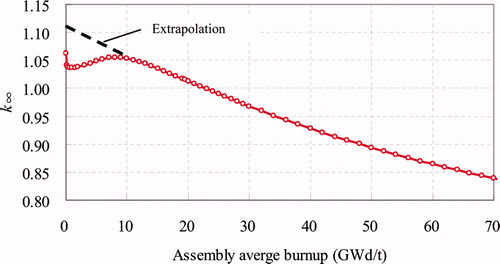
Figure 21. Infinite multiplication factor (k ∞) of a typical axial node of the 9 × 9 MOX assembly.