Figures & data
Figure 1. Volume time series in tanks from GU-RPSP without measurement error or process variation: (a) input accountability tank (Stage 1 IAT); (b) buffer tank 1 (Stage 1 Buffer 1); (c) buffer tank 2 (Stage 1 Buffer 2); (d) control tank (Stage 1 control).
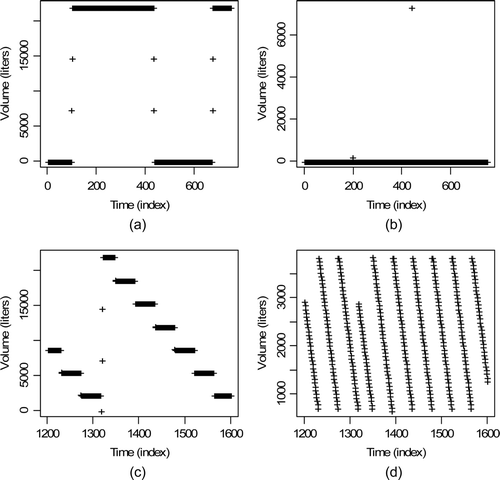
Figure 2. (a) Percent volume relative TD from tank 1 (IAT) to tank 2 (buffer) for each of 1000 batches. The upper line near 14% is at twice the simulated-based approximation estimates RSD of 7%. (b) Estimated probability density of the percent volume relative TD.
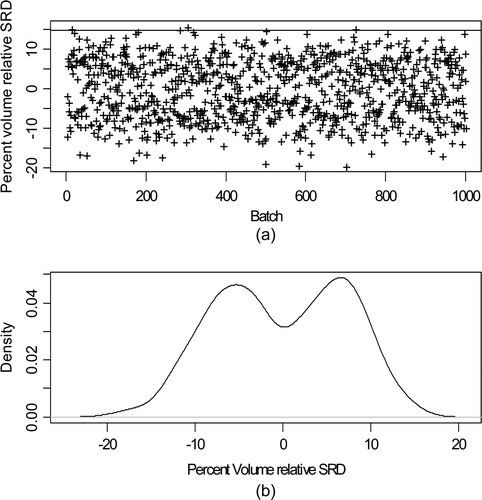
Figure 3. Same as Figure 2, but for tank 3 (buffer) to tank 4 (control) shipments.
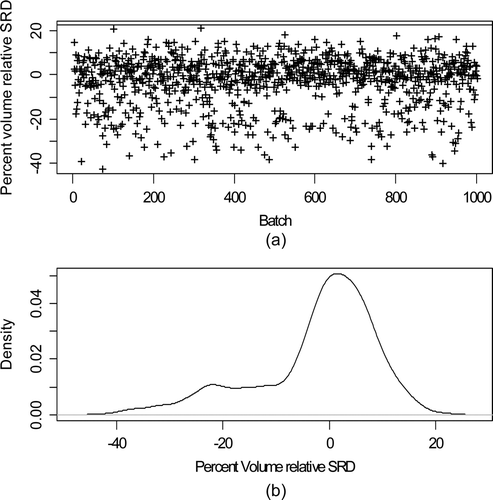
Figure 4. Alarm probability versus mean shift. The mean shift persisted for 30 batches and was constant in magnitude ranging from 0.05 to 1 times the volume TD standard deviation and the mass TD standard deviation. (a) Input accountability tank to buffer tank (see Figure 1a and b); (b) buffer tank to control tank (see Figure 1c and d).
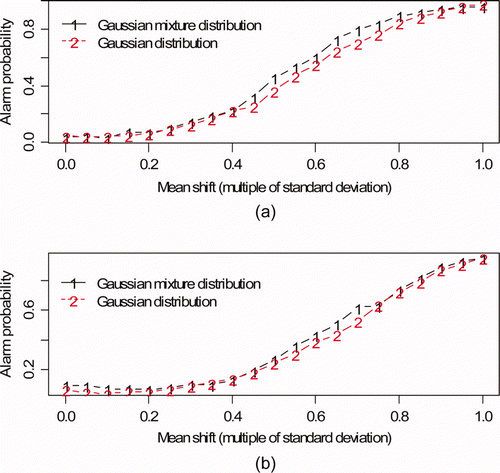
Figure 5. Input tank wait mode: (a) Percent volume relative change during the tank 1 (IAT) wait modes for each of 1000 batches; (b) Estimated probability density of the percent volume relative change.
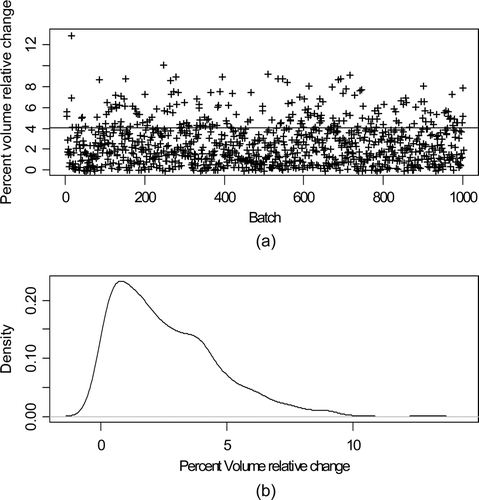
Figure 6. Buffer tank wait mode: (a) Percent volume relative TD during the tank 3 (control) wait modes for each of 1000 batches; (b) Estimated probability density of the percent volume relative change.
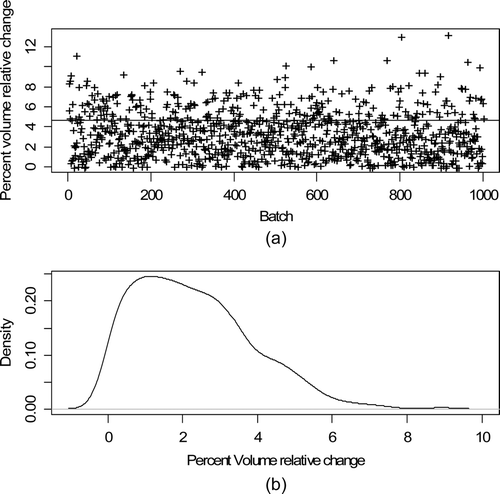
Figure 7. Alarm probability versus mean shift. The mean shift persisted for 30 wait modes and was constant in magnitude ranging from 0.05 to 1 times the volume change standard deviation and the mass change standard deviation. (a) Input accountability tank. (b) Buffer tank.
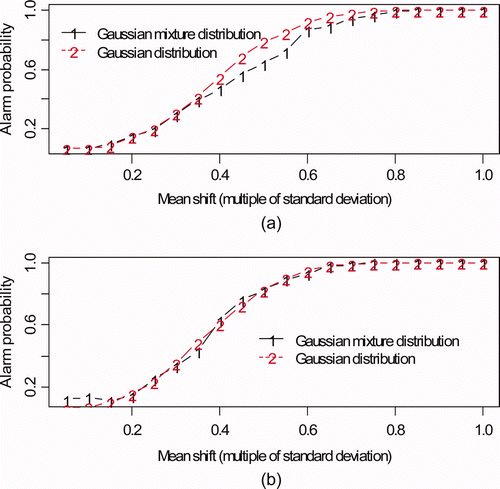
Figure 8. Alarm probability versus mean shift, same as Figure 7 (a) (input accountability tank), but based on 30, 100, or 1000 training observations. The mean shift persisted for 30 wait modes and was constant in magnitude ranging from 0.05 to 1 times the volume change standard deviation and the mass change standard deviation.
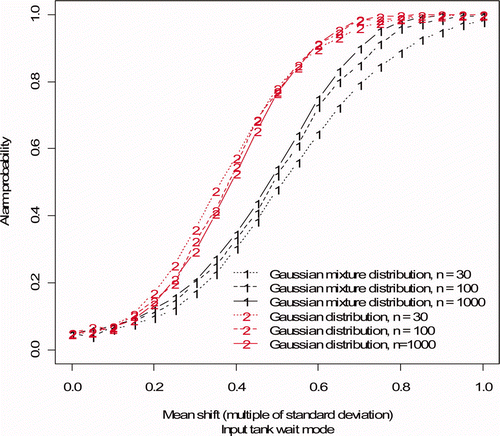
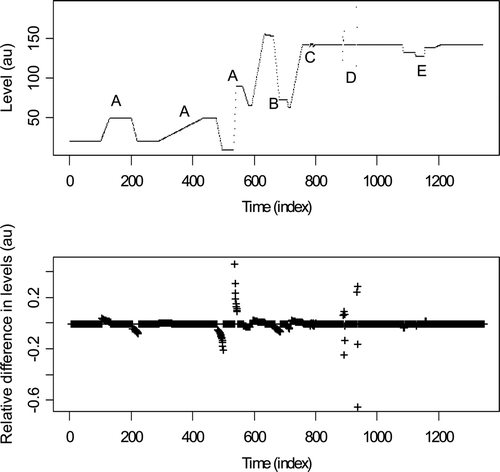
Figure 9. The impact of data collection frequency on event marking for the stage 1 control tank. The vertical lines depict possible data collection times. Notice that the maximum of some fill cycles is not directly observed (such as the one near time index 1320 or near index 1400.
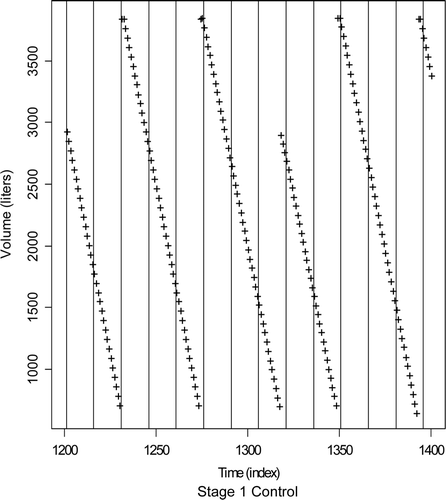
Figure 10. Real data example. Normalized level in arbitrary units (au) versus time for two tanks at Savannah River Plant during 2005 (99 and 73 wait modes, respectively). (a) May 2005: tank 17-2. (b) May 2005: tank B3-1. (c) May 2005: tank 17-2. (d) May 2005: tank B3-1.
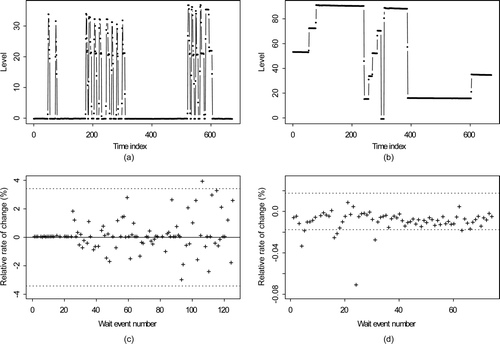
Figure 11. Estimated density and normal probability plots of the relative rates of change in (a) Tank 17-2 wait mode. (b) Tank B3-1 wait mode.
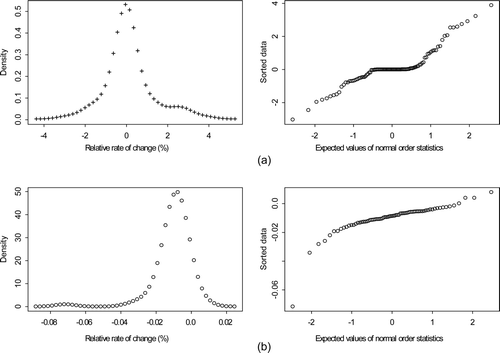
Figure 12. Mass, volume pairs for (a) tank B3-1 and (b) tank E4-2 during 129 and 208 wait modes. Estimated AP versus mean shift for (c) tank B3-1 and (d) tank as in Figure 7a where the mean shift persisted for 30 wait modes and was constant in magnitude ranging from 0.05 to 1 times the volume change standard deviation and the mass change standard deviation.
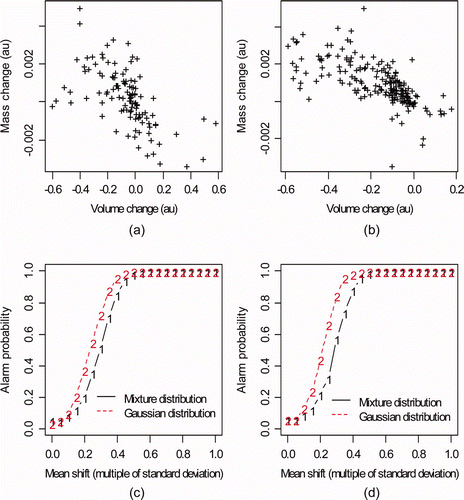
Figure 13. Example of different batches (simulated data without measurement error).