Figures & data
Figure 1. A mass and heat balance model for the evaluation of pressures and temperatures based on the situation inside the vessel and the inlet/outlet conditions.
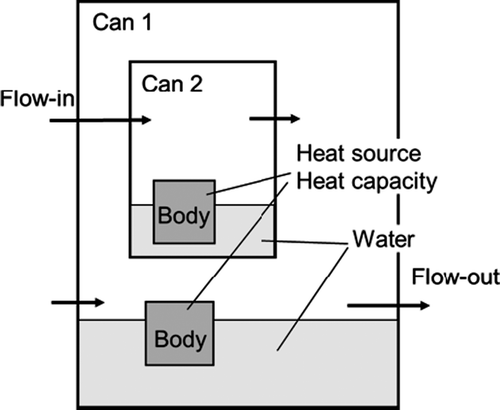
Figure 2. Concept of the “Hot Can” model.
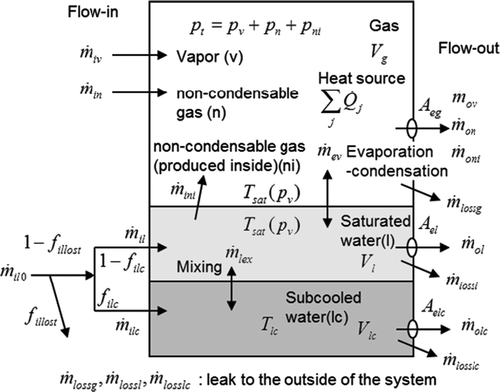
Figure 3. Concept of the “Hot Body” model (consideration on the dry and wet parts).
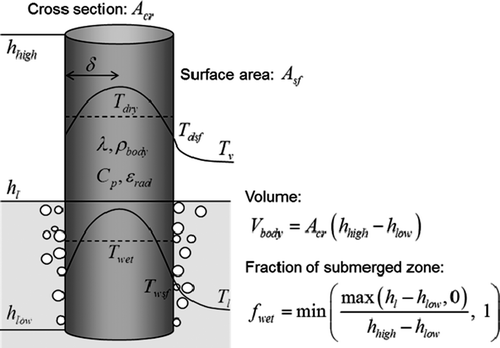
Figure 4. Solution method for the surface temperature (Left: when the heat flux is a monotonic function of the wall temperature, Right: when the function is not monotonic (boiling curve). The horizontal axis variable is noted by with asterisk meaning it is parametrically moved).
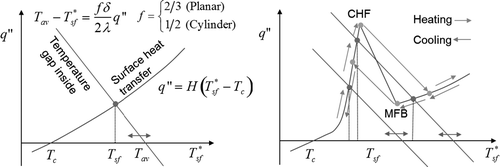
Table 1. Heat transfer correlation used in the HOTCB code.
Figure 5. The arrangement of cans and bodies in the HOTCB, and the calculation procedure (multiple cans in tandem can be modeled, with multiple bodies in each can).
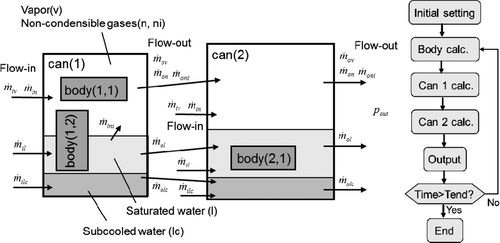
Table 2. Major initial and boundary conditions for analyses of the Unit 1 reactor.
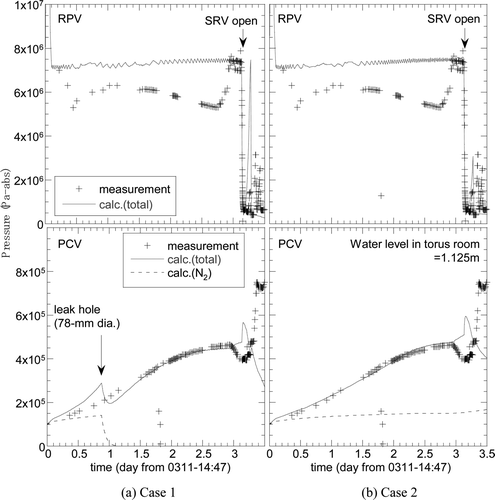
Figure 6. Pressure response of the Unit 1 reactor during the first three days calculated by the HOTCB. (a) Case 1: all of water initially retained in the PCV is handled as “saturated water”, (b) Case 2: 40% of water inventory in the PCV is isolated from the saturation system as “subcooled water” assuming thermal stratification in the SC.
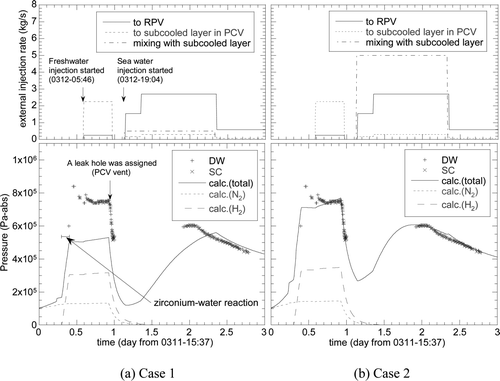
Figure 7. Calculation results of core debris temperature and the PCV pressures of the Unit 1 reactor for the boundary conditions of Case 2 specified in Table 2.
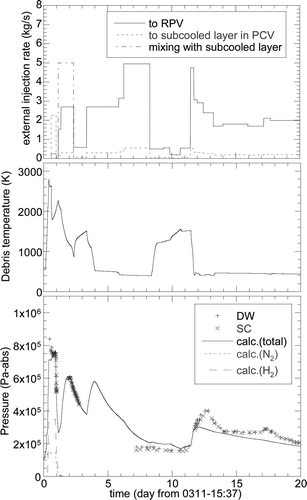
Figure 8. Calculation results of core debris temperature and the PCV pressures of the Unit 1 reactor for the boundary condition of Case 3 (solid lines) and Case 4 (dashed lines) specified in Table 2 assuming that the external water injection rate was reduced by half during the entire calculation period (Case 3) and the period after 8.0 days (Case 4).
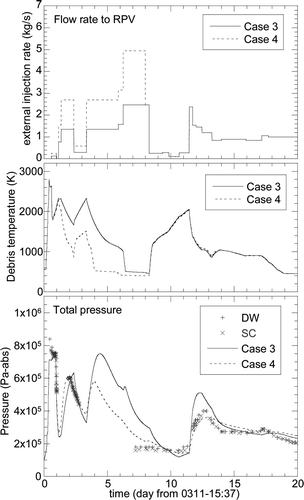
Figure 9. Calculated PCV pressure for the Units 2 reactor assuming adiabatic conditions: no heat removal and no leakage from the PCV.
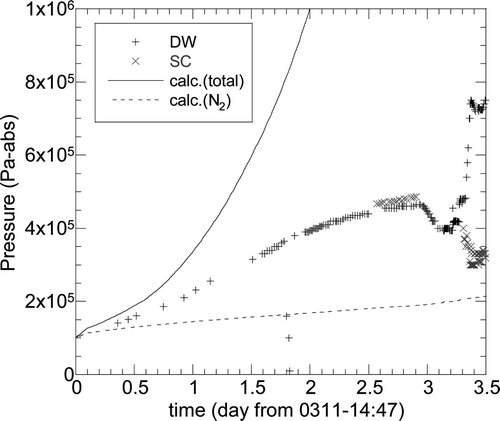
Figure 10. Illustration of wall heat transfer model for the analysis of the Unit 2 reactor (the case of flooding into the torus room).
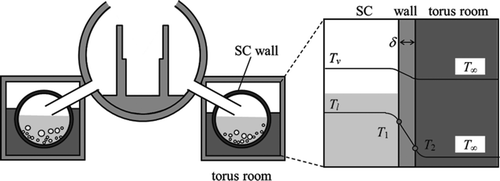
Figure 11. Calculation results of RPV and PCV pressures for the analysis of the Unit 2 reactor. (a) Case 1: assuming heat loss by gas leakage from the PCV, (b) Case 2: assuming heat loss by heat transfer on the SC outer surface.