Figures & data
Figure 1. Propagation of acoustic-induced vibration from SRV to the steam dryer.
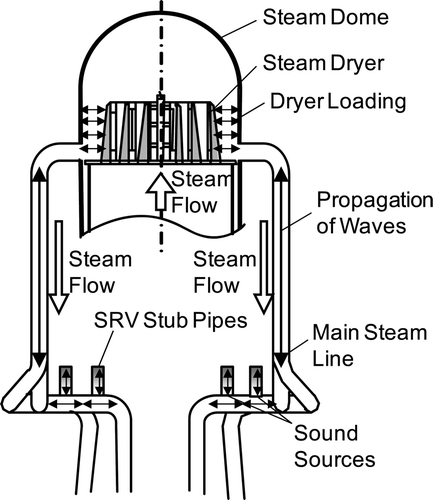
Figure 2. Mechanism of flow-acoustic resonance at the SRV stub pipe.
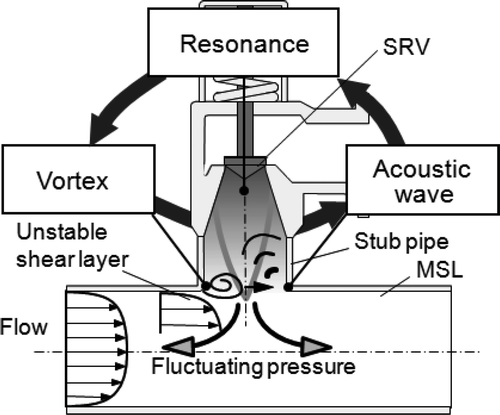
Figure 3. Calculation procedure of the conventional FDLBM [Citation23].
![Figure 3. Calculation procedure of the conventional FDLBM [Citation23].](/cms/asset/f13f90a3-87ac-48d0-9195-3d7c217f27c9/tnst_a_703943_o_f0003g.gif)
Figure 4. Calculation procedure of the developed method.
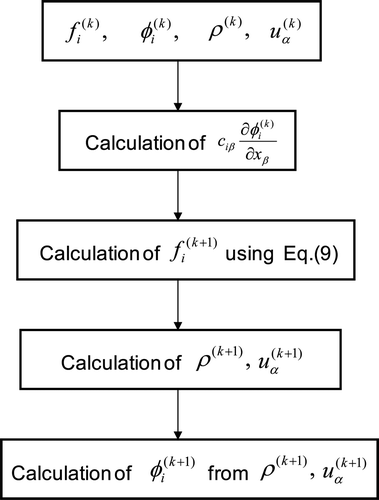
Figure 5. Distribution of the molecule velocities ci α [Citation26].
![Figure 5. Distribution of the molecule velocities ci α [Citation26].](/cms/asset/9b10f7c3-6d74-48b6-98d8-713c65e12190/tnst_a_703943_o_f0005g.gif)
Table 1. Cartesian components of the molecule velocities [Citation26], where  and .
and .
Figure 6. Computational grid for simulation of the cavity driven flow.
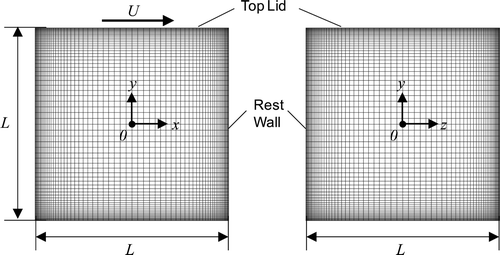
Figure 7. Time-averaged flow in the cavity driven flow simulation.
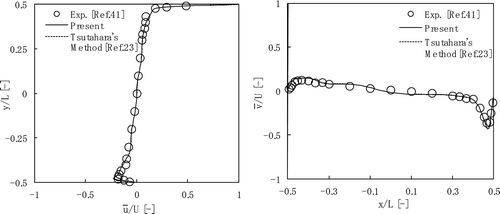
Table 2. Comparison between the developed method and the conventional FDLBM [Citation23].
Figure 8. Schematic presentation of the test facility [Citation3].
![Figure 8. Schematic presentation of the test facility [Citation3].](/cms/asset/b37c38ea-893d-4ed8-8dd7-ccf0b1efb0e8/tnst_a_703943_o_f0008g.gif)
Table 3. Physical properties of the fluid.
Figure 9. Computational grid for simulations of the flow-acoustic resonance.
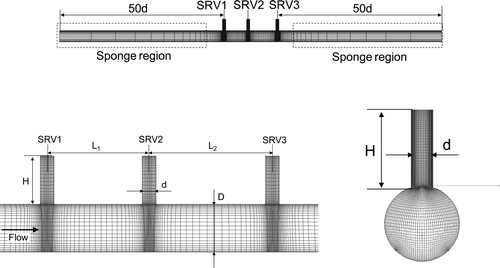
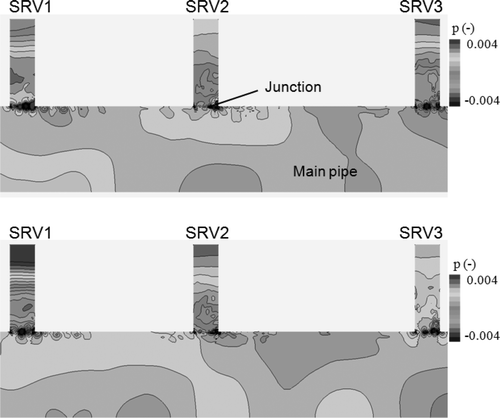
Figure 10. Pressure fluctuations on the top of the SRV stub pipes at St = 0.36.
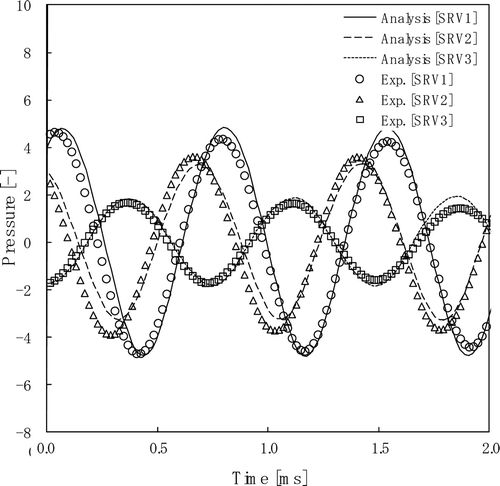
Figure 11. Amplitudes of the pressure fluctuations as functions of the Strouhal number.
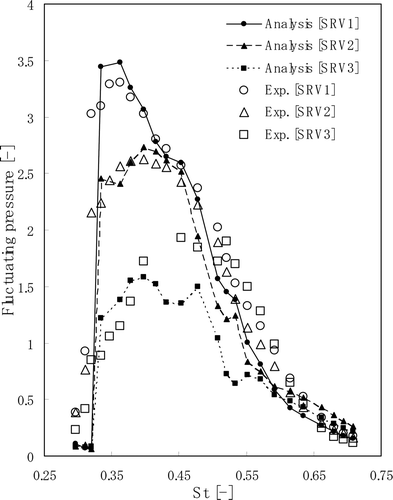
Figure 12. Unsteady motion of the vortex at the stub pipe of SRV1 (left, vorticity; right, pressure).
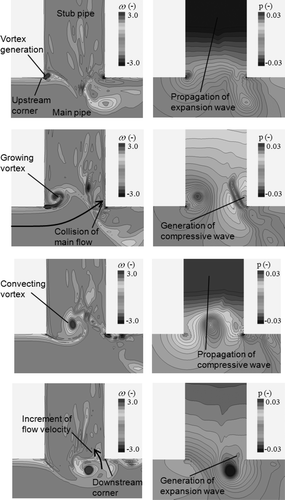
Figure 13. Pressure distribution in the SRV stub pipes at St = 0.36.
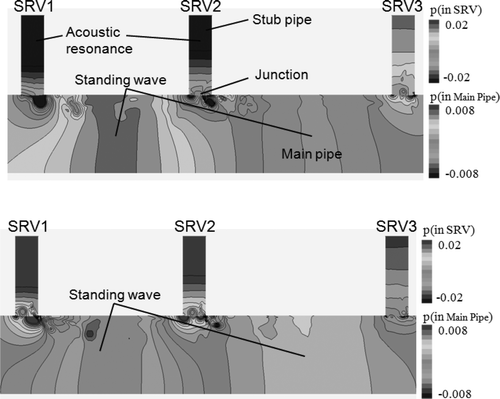
Figure 14. Pressure distribution in the SRV stub pipes at St = 0.29.