Figures & data
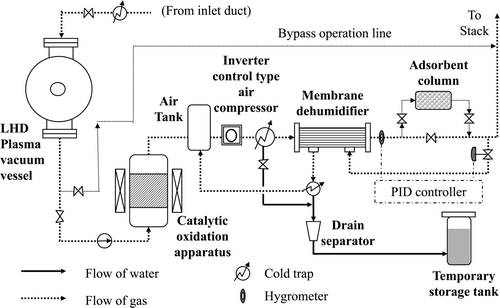
Figure 1. System flow of test apparatus.
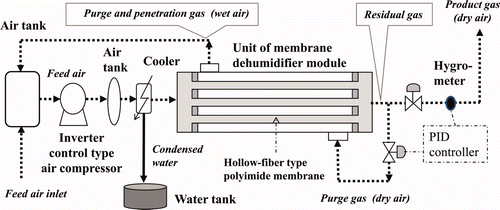
Table 1. Operating conditions.
Figure 2. Transitional change of the dew point under PID control operation.
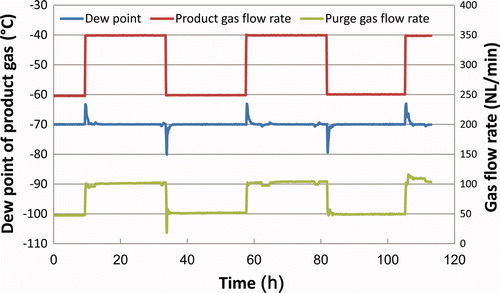
Figure 3. Transitional change of the dew point under fixed purge ratio operation at (1) 0.6 MPa(G) and (2) 0.8 MPa(G).
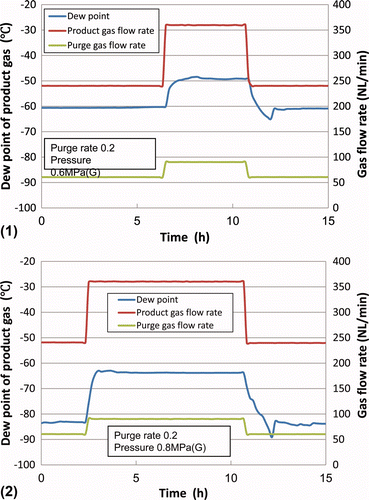
Figure 4. Transitional change of the dew point under optimal fixed purge ratio operation.
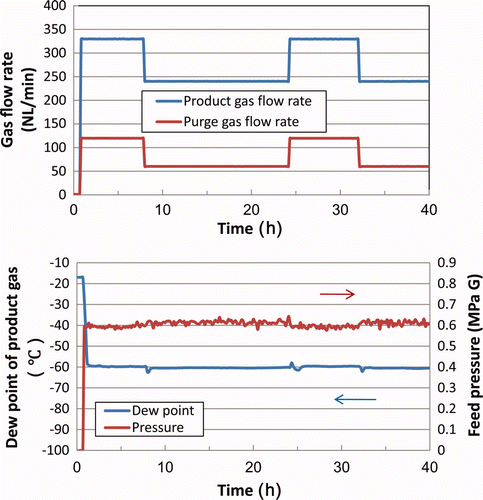
Figure 5. Detailed transitional change of the dew point upon an increase in purge gas flow rate (1) with overshooting and (2) without overshooting.
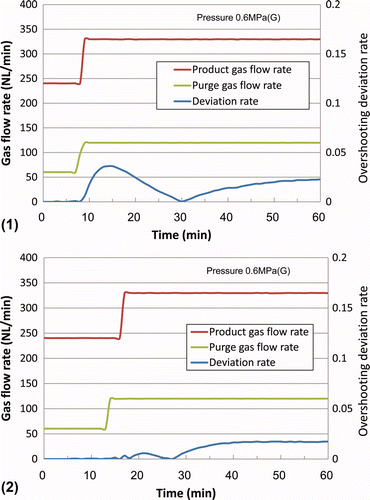
Figure 6. Detailed transitional change of the dew point upon an increase in purge gas flow rate (1) with undershooting and (2) without undershooting.
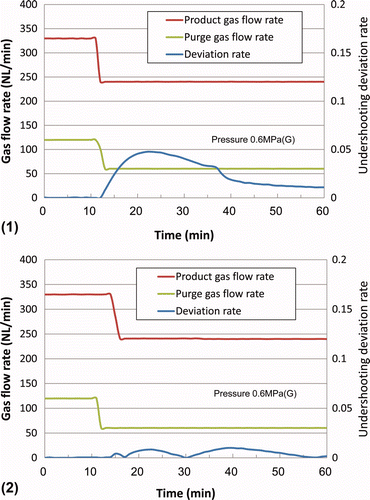
Figure 7. Differential model for membrane dehumidifier module.
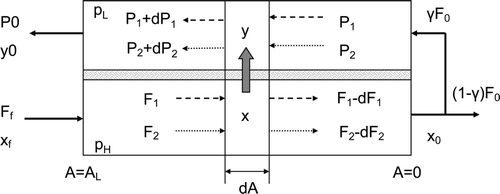
Figure 8. Relationship between dew point and purge ratio at (1) 0.6 MPa(G), (2) 0.7 MPa(G), and (3) 0.8 MPa(G).
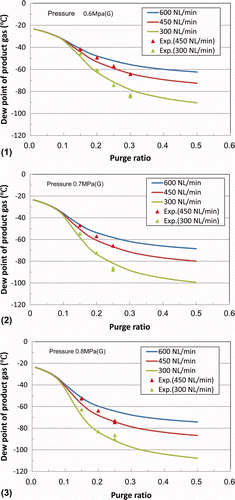
Figure 9. Relationship between penetration gas flow rate and purge ratio.
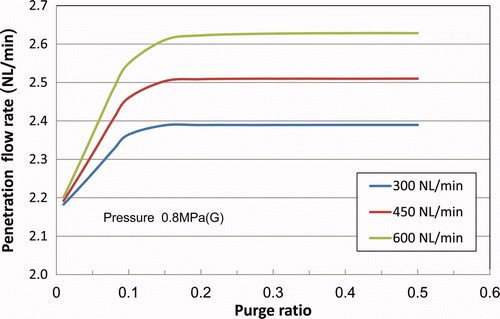
Figure 10. Relationship between moisture recovery ratio and purge ratio at (1) 0.6 MPa(G), (2) 0.7 MPa(G), and (3) 0.8 MPa(G).
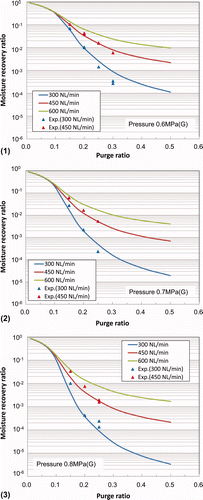
Figure 11. Dependency of product gas dew point on inlet moisture concentration.
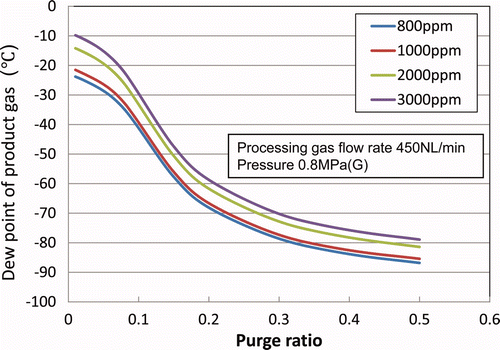
Figure 12. Axial distribution of moisture concentration inside and outside a hollow-fiber membrane module at 0.8 MPa(G).
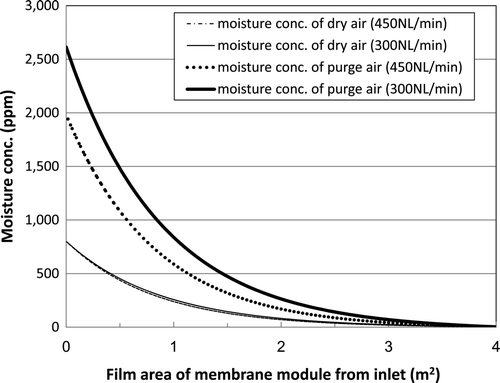
Figure 13. Design and flow of detritiation system for the LHD.