Figures & data
Figure 1. Schematic of in situ monitoring system. (a) Schematic of test section and measurement systems and (b) photo of wire probe connected with lead wire.
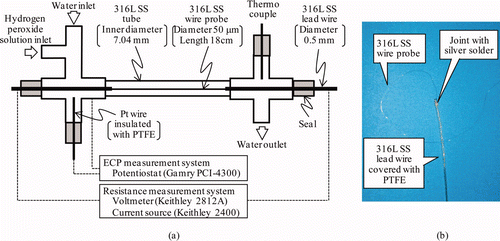
Figure 2. SEM image of (a) cross section and (b) surface of as-received 316L SS wire probe.
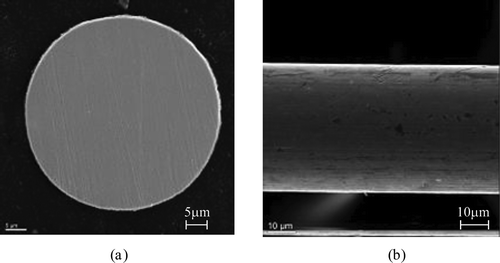
Figure 3. Outline of high-temperature, high-pressure loop.
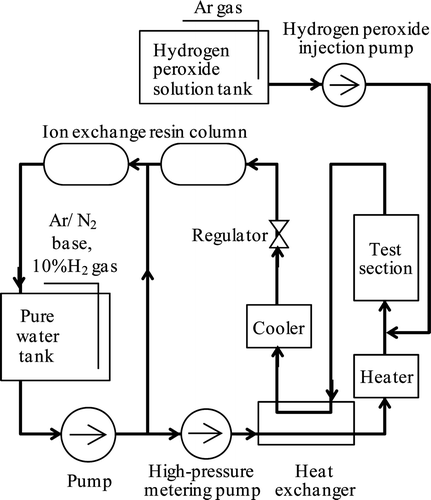
Table 1. Operating conditions of high-temperature, high-pressure loop.
Table 2. Water chemistry conditions.
Figure 4. Resistance change during temperature elevation for Run 1.
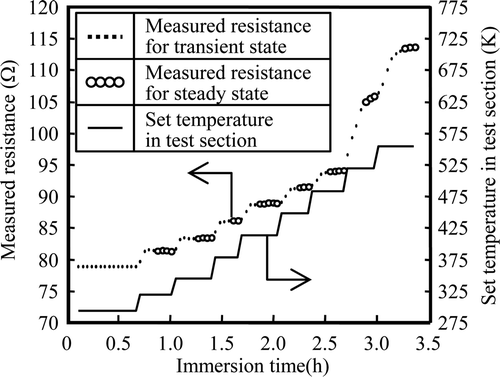
Figure 5. Temperature dependence of resistivity of 316L SS wire probe.
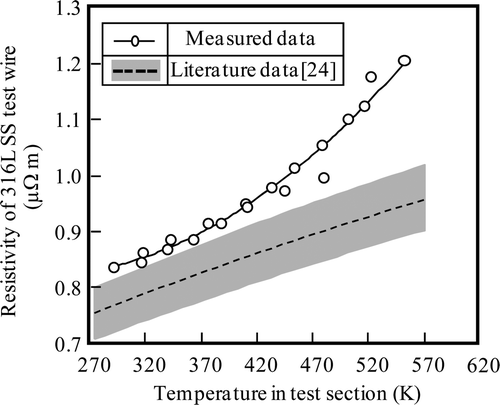
Figure 6. Immersion time dependence of measured resistance for Run 1.
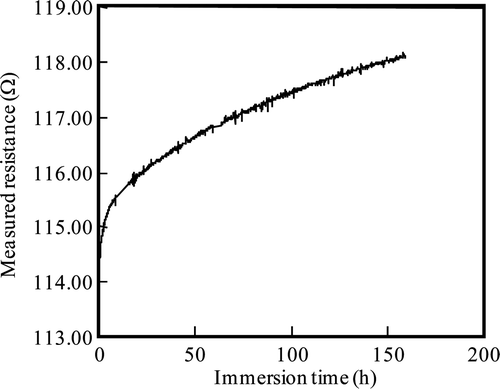
Figure 7. Comparison of corrosion depth of 316L SS under HWC condition among literature data and results of this work for Run 1.
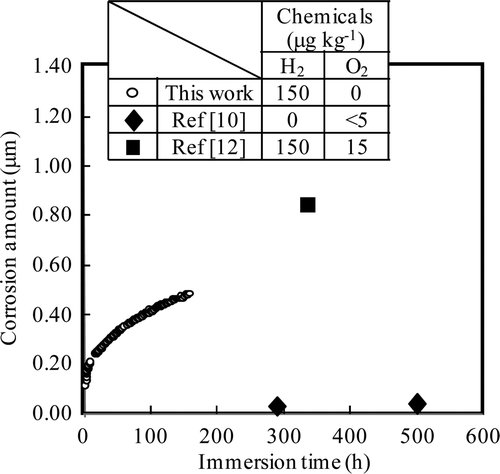
Table 3. Measured ECP of steady state.
Figure 8. Comparison of corrosion depth of 316L SS under NWC condition among literature data and results of this work for Run 2.
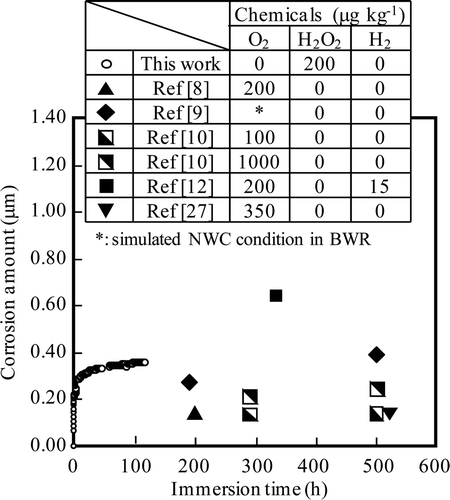
Figure 9. SEM image of surface and cross section of oxide film formed under HWC condition for Run 1.
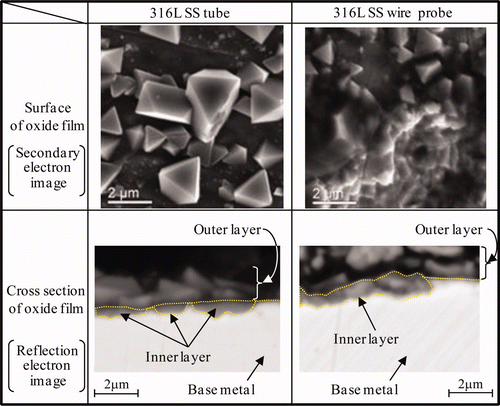
Figure 10. Raman spectra of oxide film formed under HWC condition for Run 1.
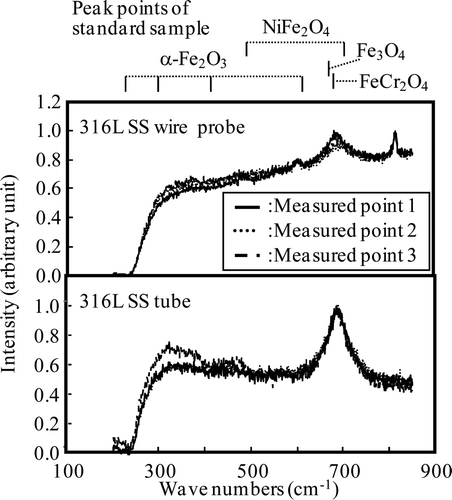
Figure 11. SEM image of surface and cross section of oxide film formed under NWC condition for Run 2.
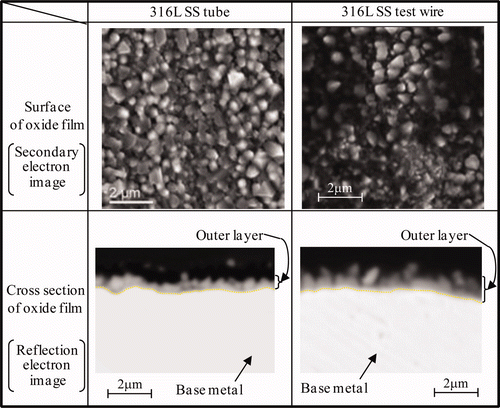
Figure 12. Raman spectra of oxide film formed under NWC condition for Run 2.
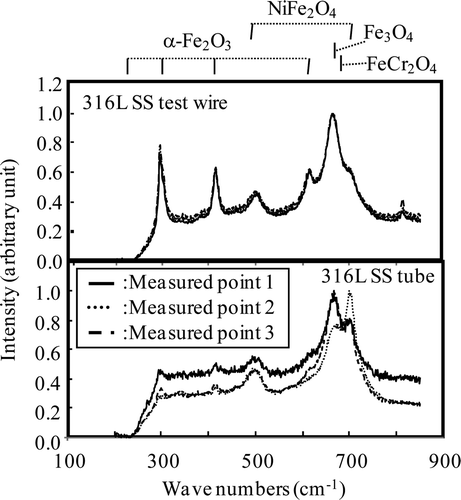
Figure 13. Fitting results of corrosion depth under HWC condition for Run 1.
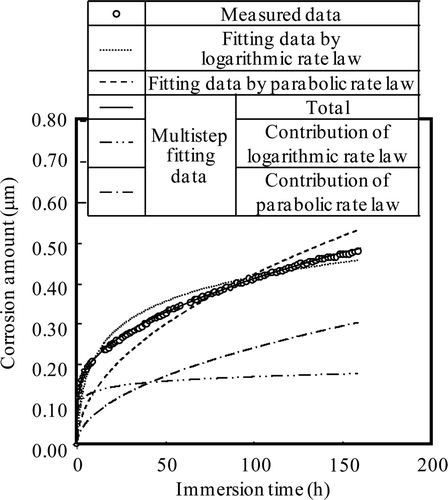
Figure 14. Fitting results of corrosion depth under NWC condition for Run 2.
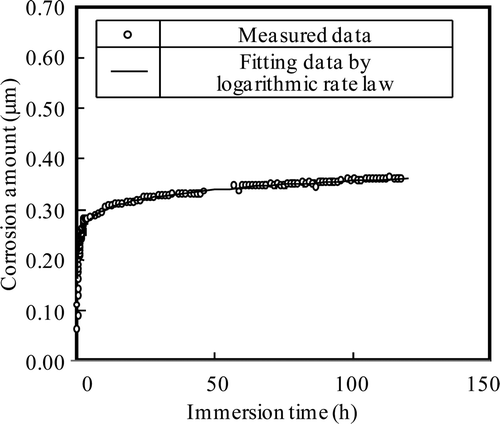
Figure 15. Corrosion rate under HWC condition, NWC condition and Run 2 calculated using fitting equations.
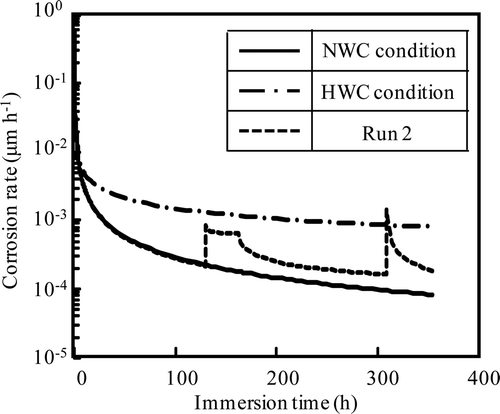
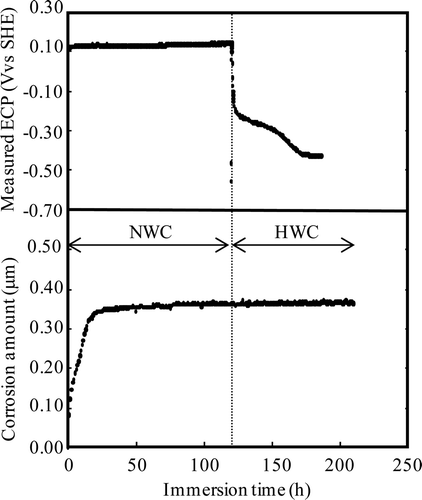
Figure 16. Effects of water chemistry change on corrosion depth for Run 2.
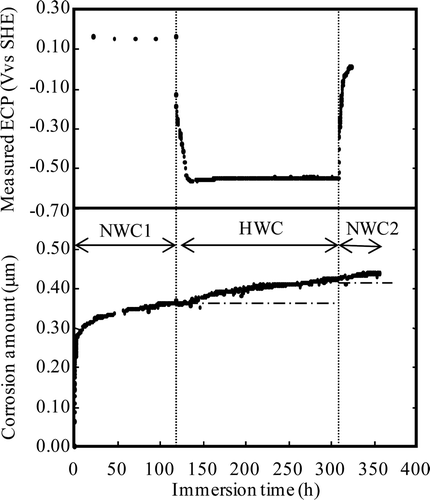
Figure 17. Effects of water chemistry change on corrosion depth for Run 3.