476
Views
3
CrossRef citations to date
0
Altmetric
ARTICLE

Energy-resolved computed tomography measurements of iron solution and adipose as a simulation for estimating the iron concentration in the human liver

, , , , , , & show all
Pages 376-380 | Received 09 Aug 2012, Accepted 07 Dec 2012, Published online: 28 Mar 2013

Figures & data

Table 1 Assigned energy ranges (keV)

Figure 1 Experimental setup for obtaining response functions

Figure 1 Experimental setup for obtaining response functions

Figure 2 Schematic drawings of 30-mm-diameter cylindrical phantoms with (a) four holes and (b) two holes. The heights of these phantoms are 60 mm
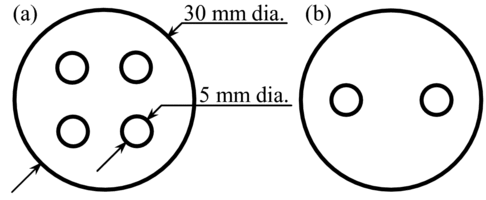
Figure 2 Schematic drawings of 30-mm-diameter cylindrical phantoms with (a) four holes and (b) two holes. The heights of these phantoms are 60 mm

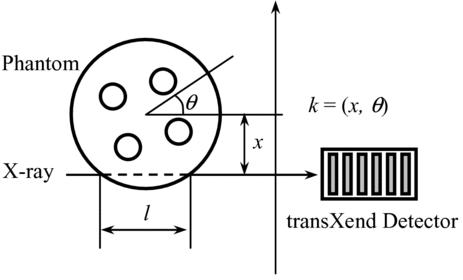
Figure 3 Relationship between x, θ and l and measurement point k

Figure 3 Relationship between x, θ and l and measurement point k

Figure 4 CT images of iron solutions with concentrations of 50, 100, 150 and 200 μmol/g obtained by (a) current-measurement CT and (b) energy-resolved CT obtained by X-ray events in the energy range E 1
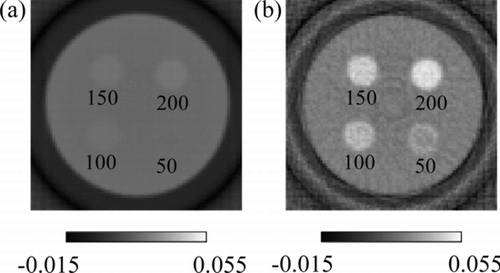
Figure 4 CT images of iron solutions with concentrations of 50, 100, 150 and 200 μmol/g obtained by (a) current-measurement CT and (b) energy-resolved CT obtained by X-ray events in the energy range E 1

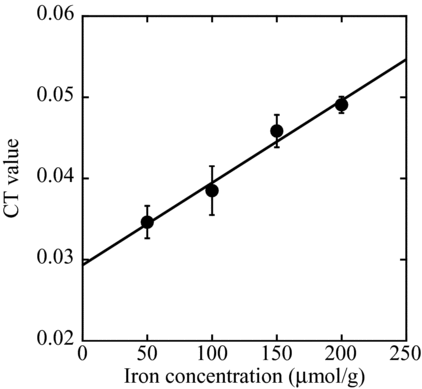
Figure 5 Relationship between the iron concentration and CT value

Figure 5 Relationship between the iron concentration and CT value

Figure 6 CT images of adipose and iron solution obtained by the X-ray events in the energy ranges (a) E 1 and (b) E 4
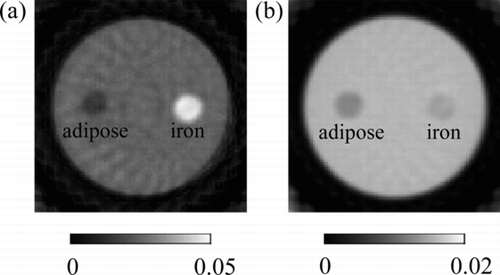
Figure 6 CT images of adipose and iron solution obtained by the X-ray events in the energy ranges (a) E 1 and (b) E 4

Figure 7 CT value profiles along the centerline of the iron and adipose regions obtained by the X-ray events in the energy ranges E 1 (solid line) and E 4 (dashed line), respectively
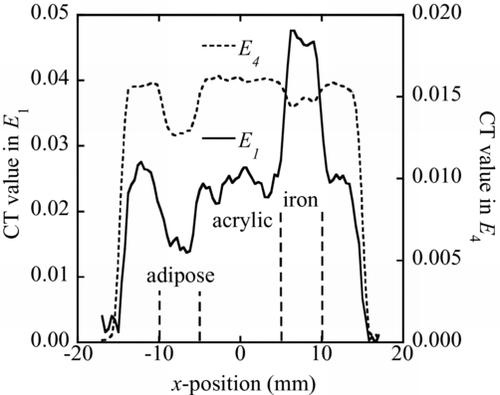
Figure 7 CT value profiles along the centerline of the iron and adipose regions obtained by the X-ray events in the energy ranges E 1 (solid line) and E 4 (dashed line), respectively

Figure 8 Linear attenuation coefficients of iron, adipose and acrylic [Citation8]

Figure 8 Linear attenuation coefficients of iron, adipose and acrylic [Citation8]

Figure 9 Two-dimensional map of CT values obtained by the X-ray events in the energy ranges E 1 and E 4 for iron, adipose and acrylic
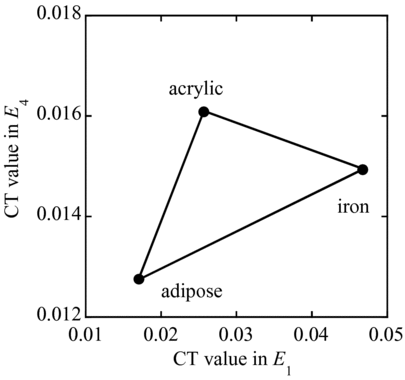
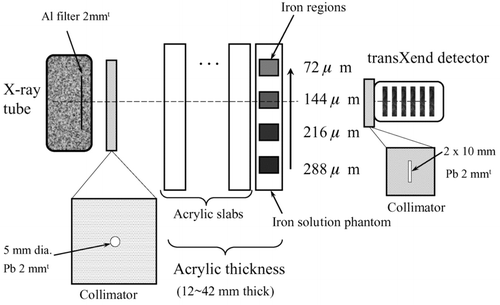
Figure 9 Two-dimensional map of CT values obtained by the X-ray events in the energy ranges E 1 and E 4 for iron, adipose and acrylic
Reprints and Corporate Permissions

Please note: Selecting permissions does not provide access to the full text of the article, please see our help page How do I view content?

To request a reprint or corporate permissions for this article, please click on the relevant link below:

Academic Permissions

Please note: Selecting permissions does not provide access to the full text of the article, please see our help page How do I view content?

Obtain permissions instantly via Rightslink by clicking on the button below:

If you are unable to obtain permissions via Rightslink, please complete and submit this Permissions form. For more information, please visit our Permissions help page.