437
Views
4
CrossRef citations to date
0
Altmetric
ARTICLE

Computed tomography reconstruction from two transmission measurements for iodine-marked cancer detection

, , , , , , , & show all
Pages 1020-1033 | Received 01 May 2013, Accepted 25 Jul 2013, Published online: 06 Sep 2013

Figures & data

Figure 1 Schematic drawing of the transXend detector

Figure 1 Schematic drawing of the transXend detector

Figure 2 Schematic drawing of the experimental setup

Figure 2 Schematic drawing of the experimental setup

Figure 3 Phantoms used for (a) the acrylic–iodine two-dimensional map, (b) the acrylic–aluminum two-dimensional map, and (c) the transmission measurements

Figure 3 Phantoms used for (a) the acrylic–iodine two-dimensional map, (b) the acrylic–aluminum two-dimensional map, and (c) the transmission measurements

Figure 4 Two-dimensional maps for (a) acrylic–iodine and (b) acrylic–aluminum relationships. The thicknesses of the iodine and the aluminum are shown in the figures
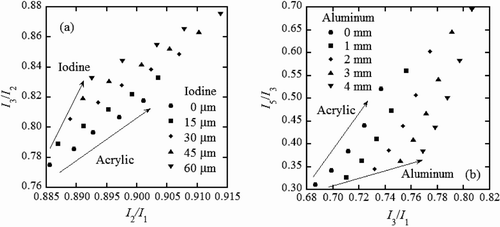
Figure 4 Two-dimensional maps for (a) acrylic–iodine and (b) acrylic–aluminum relationships. The thicknesses of the iodine and the aluminum are shown in the figures

Figure 5 Scan results for the cylindrical acrylic phantom (Figure 3(c)) at 0 degrees in (a) acrylic–iodine and (b) acrylic–aluminum two-dimensional maps. The symbols are the same as those used in
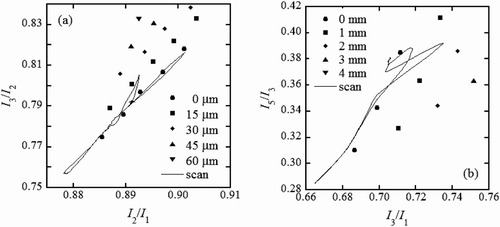
Figure 5 Scan results for the cylindrical acrylic phantom (Figure 3(c)) at 0 degrees in (a) acrylic–iodine and (b) acrylic–aluminum two-dimensional maps. The symbols are the same as those used in Figure 4

Figure 6 The content is the same as in , but measured at 90 degrees

Figure 6 The content is the same as in Figure 5, but measured at 90 degrees

Figure 7 Estimated thickness distributions obtained from the electric current ratios for (a) acrylic (circles)–iodine (squares) and (b) acrylic (circles)–aluminum (triangles) for a 0-degree scan. The solid lines act as guides for the eye
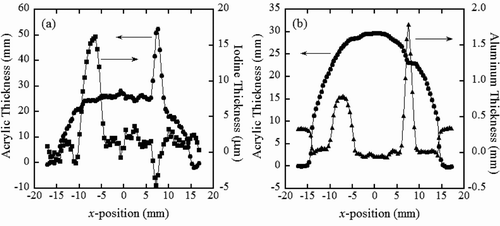
Figure 7 Estimated thickness distributions obtained from the electric current ratios for (a) acrylic (circles)–iodine (squares) and (b) acrylic (circles)–aluminum (triangles) for a 0-degree scan. The solid lines act as guides for the eye

Figure 8 The content is the same as that of , but for a scan at 90 degrees

Figure 8 The content is the same as that of Figure 7, but for a scan at 90 degrees

Table 1 Acrylic, iodine, and aluminum thicknesses used for correction for the hidden materials in the two-dimensional maps based on the electric current ratios

Figure 9 Estimations of the X-ray absorption by the hidden materials: (a) the effect of aluminum on the acrylic–iodine relationship and (b) the effect of iodine on the acrylic–aluminum relationship
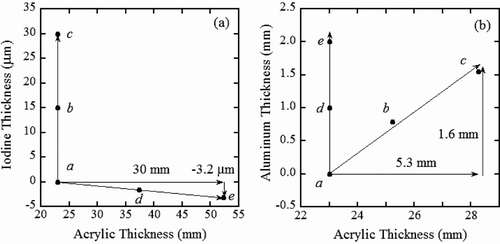
Figure 9 Estimations of the X-ray absorption by the hidden materials: (a) the effect of aluminum on the acrylic–iodine relationship and (b) the effect of iodine on the acrylic–aluminum relationship

Figure 10 Material thickness distributions obtained from the electric current ratios after correcting for the effects of the hidden materials. Acrylic (circles), iodine (squares), and aluminum (triangles) are shown for (a) 0 degree scan and (b) a 90-degree scan. The dashed lines indicate the expected thickness distributions for each material. An aluminum thickness of 1 mm is expressed as 15 μm thick iodine for a clear comparison
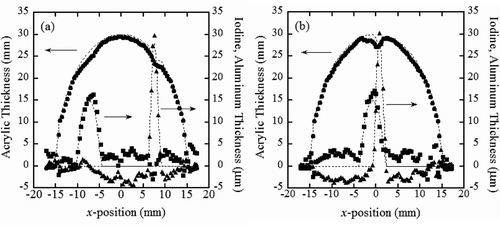
Figure 10 Material thickness distributions obtained from the electric current ratios after correcting for the effects of the hidden materials. Acrylic (circles), iodine (squares), and aluminum (triangles) are shown for (a) 0 degree scan and (b) a 90-degree scan. The dashed lines indicate the expected thickness distributions for each material. An aluminum thickness of 1 mm is expressed as 15 μm thick iodine for a clear comparison

Table 2 Energy ranges for unfolding of the X-ray energy distributions

Figure 11 Two-dimensional maps obtained from the calculated X-ray event ratios for (a) acrylic–iodine and (b) acrylic–aluminum relationships. The thicknesses of iodine and aluminum are shown in the figures. Yi (where i = 1,4) is the number of events in the energy range assigned in
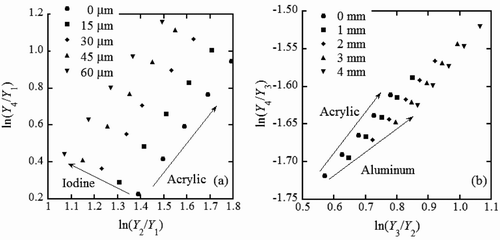
Figure 11 Two-dimensional maps obtained from the calculated X-ray event ratios for (a) acrylic–iodine and (b) acrylic–aluminum relationships. The thicknesses of iodine and aluminum are shown in the figures. Yi (where i = 1,4) is the number of events in the energy range assigned in Table 2

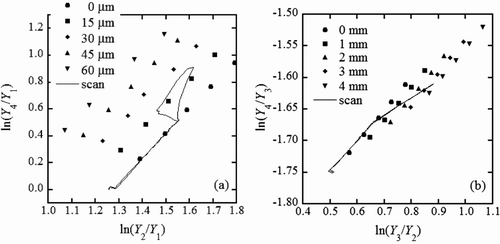
Figure 12 Two-dimensional maps obtained experimentally from the X-ray event ratios (symbols) and the scan results (solid lines) at 0 degrees for (a) acrylic–iodine and (b) acrylic–aluminum relationships
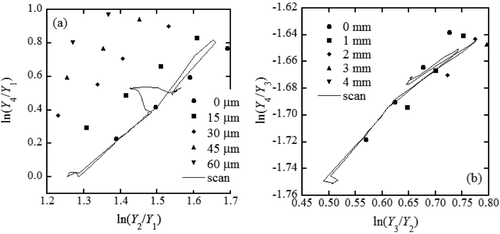
Figure 12 Two-dimensional maps obtained experimentally from the X-ray event ratios (symbols) and the scan results (solid lines) at 0 degrees for (a) acrylic–iodine and (b) acrylic–aluminum relationships

Figure 13 The content is the same as that of , but for a 90-degree scan

Figure 13 The content is the same as that of Figure 12, but for a 90-degree scan

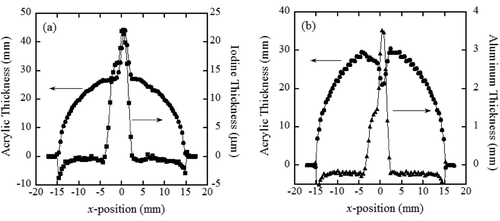
Figure 14 Estimated thickness distributions obtained from the X-ray event ratios for (a) acrylic (circles)–iodine (squares) and (b) acrylic (circles)–aluminum (triangles) for a 0-degree scan. The solid lines act as a guide for the eye
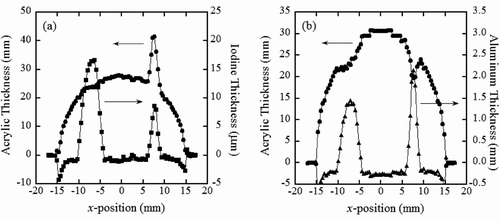
Figure 14 Estimated thickness distributions obtained from the X-ray event ratios for (a) acrylic (circles)–iodine (squares) and (b) acrylic (circles)–aluminum (triangles) for a 0-degree scan. The solid lines act as a guide for the eye

Figure 15 The content is the same as that of , but for a 90-degree scan

Figure 15 The content is the same as that of Figure 14, but for a 90-degree scan

Table 3 Acrylic, iodine, and aluminum thicknesses used for correction for the hidden materials in the two-dimensional maps based on the X-ray event ratios

Figure 16 Material thickness distributions obtained from the X-ray event ratios after correcting for the effects of the hidden materials. Acrylic (circles), iodine (squares), and aluminum (triangles) are shown for (a) 0 degree scan and (b) a 90-degree scan. The dashed lines indicate the expected thickness distributions for each material. An aluminum thickness of 1 mm is expressed as 15 μm thick iodine for a clear comparison
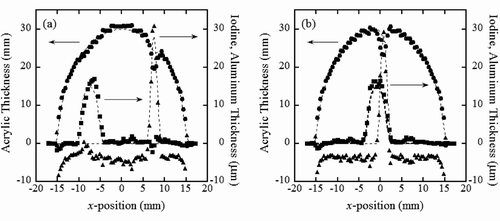
Figure 16 Material thickness distributions obtained from the X-ray event ratios after correcting for the effects of the hidden materials. Acrylic (circles), iodine (squares), and aluminum (triangles) are shown for (a) 0 degree scan and (b) a 90-degree scan. The dashed lines indicate the expected thickness distributions for each material. An aluminum thickness of 1 mm is expressed as 15 μm thick iodine for a clear comparison

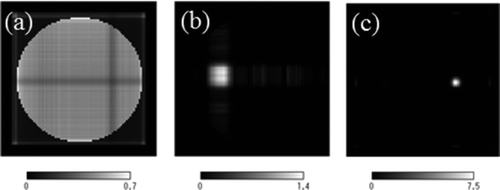
Figure 17 Tomographies obtained from the electric current ratios for (a) acrylic, (b) iodine, and (c) aluminum by using the ML-EM method. The circular shape of the acrylic is given during the image reconstruction process
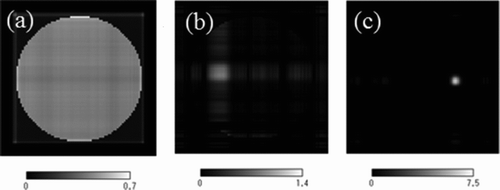
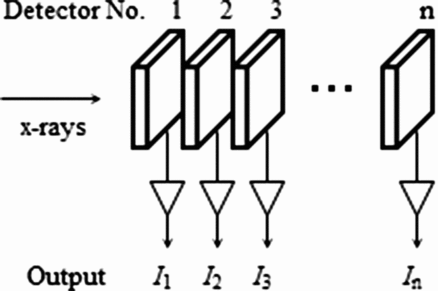
Figure 17 Tomographies obtained from the electric current ratios for (a) acrylic, (b) iodine, and (c) aluminum by using the ML-EM method. The circular shape of the acrylic is given during the image reconstruction process
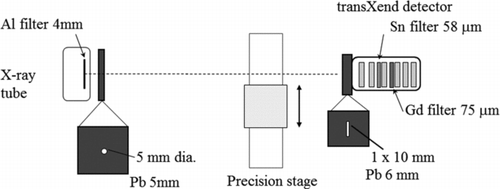
Figure 18 The content is the same as that of , but was obtained using the X-ray event ratios

Figure 18 The content is the same as that of Figure 17, but was obtained using the X-ray event ratios

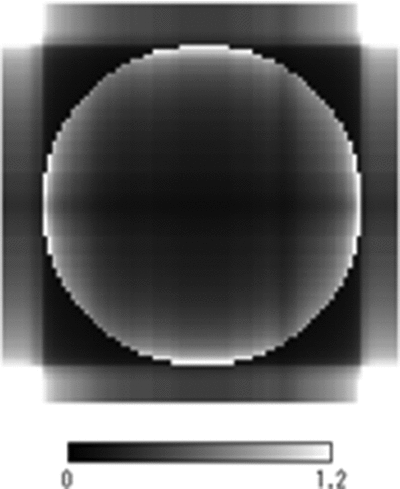
Figure 19 Tomography of the acrylic phantom obtained by using the electric currents measured by 0- and 90-degree scans. The circular shape of the acrylic is given during the image reconstruction process using the ML-EM method
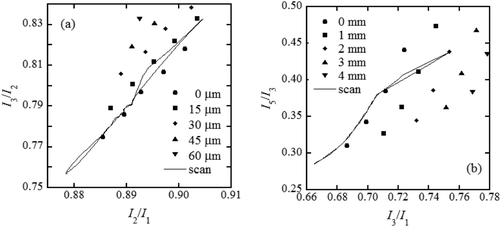
Figure 19 Tomography of the acrylic phantom obtained by using the electric currents measured by 0- and 90-degree scans. The circular shape of the acrylic is given during the image reconstruction process using the ML-EM method
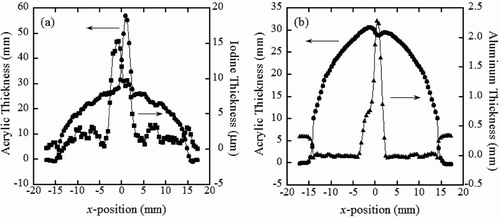
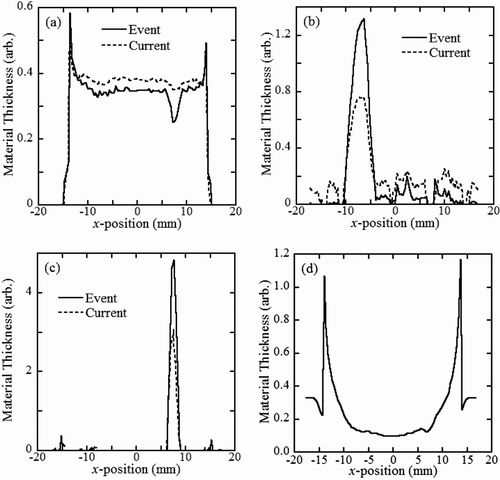
Figure 20 Profiles of the tomographic images of and are shown for (a) acrylic, (b) iodine, and (c) aluminum, as well as (d) the acrylic phantom of . “Event” and “current” in (a)–(c) indicate the profiles obtained from the X-ray event ratios and from the electric current ratios, respectively

Figure 20 Profiles of the tomographic images of Figures 17 and 18 are shown for (a) acrylic, (b) iodine, and (c) aluminum, as well as (d) the acrylic phantom of Figure 19. “Event” and “current” in (a)–(c) indicate the profiles obtained from the X-ray event ratios and from the electric current ratios, respectively

Reprints and Corporate Permissions

Please note: Selecting permissions does not provide access to the full text of the article, please see our help page How do I view content?

To request a reprint or corporate permissions for this article, please click on the relevant link below:

Academic Permissions

Please note: Selecting permissions does not provide access to the full text of the article, please see our help page How do I view content?

Obtain permissions instantly via Rightslink by clicking on the button below:

If you are unable to obtain permissions via Rightslink, please complete and submit this Permissions form. For more information, please visit our Permissions help page.