Figures & data
Figure 1. Schematic view of liquid film sensor.
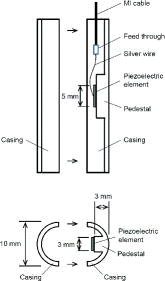
Figure 2. Sensor casing inside which the piezoelectric element was attached.
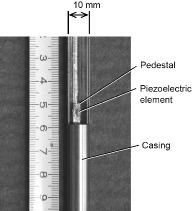
Figure 3. Confirmation of temperature rise due to laser welding: (a) measurement point locations; (b) temperature change due to laser welding.
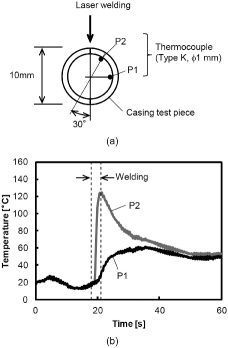
Figure 4. Micro photograph of the laser welded part.
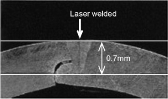
Figure 5. Instrument configuration: (a) connection with the instrument; (b) configuration for observing the pulse reflected from the casing surface; (c), (d) configuration for observing the pulse reflected from the liquid film surface.
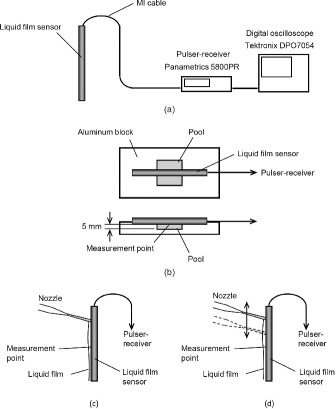
Figure 6. Waveforms obtained on an oscilloscope: (a) for the fixed nozzle position; (b) for the moving nozzle position.
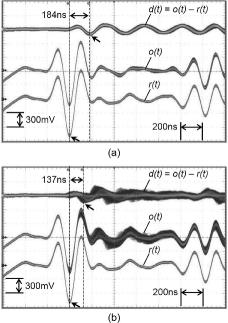
Figure 7. Time series liquid film thickness: (a) for the fixed nozzle position; (b) for the moving nozzle position.
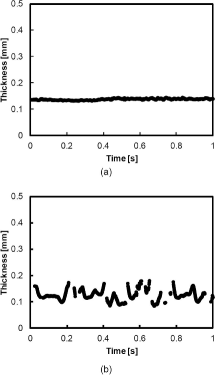
Figure 8. Frequency characteristic of the liquid film sensor.
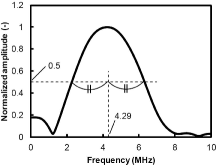
Figure 9. Amplitude decrease by reflection and transmission.
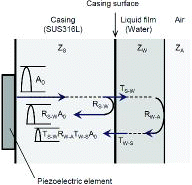
Table 1. Material properties at room temperature (20 °C).
Figure 10. Confirmation of amplitude calculated by the acoustic impedance.
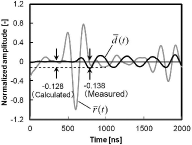
Table 2. Material properties at 286 °C.
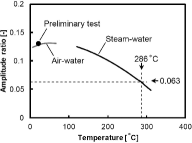
Figure 11. Predicted amplitude ratio at 286 °C.