Figures & data
Figure 1. (a) Photograph of a G-GEM and (b) magnified photograph of the holes. The hole diameter and pitch is 170 and 280 μm, respectively.
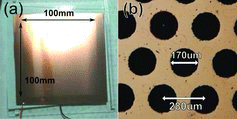
Figure 2. A photograph of G-GEM, the metal part of which is heavily damaged by sparks.
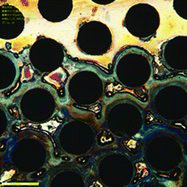
Figure 3. (a) Photograph of the G-GEM guard ring. The sensitive area is 100 mm × 100 mm. (b) A magnified photograph of the holes. The guard-ring width, gap between the ring and hole, hole diameter, and hole pitch are 20, 20, 160, and 280 μm, respectively.
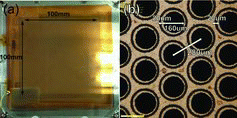
Figure 4. The calculation model from the (a) top view and (b) view from a different angle. The guard-ring structure is created only on a single side. The ring width, gap between the ring and hole, hole diameter, hole pitch, and thickness of the glass substrate, are 20, 20, 160, 280, and 680 μm, respectively. The dielectric constant is 6.28 for the PEG3 glass.
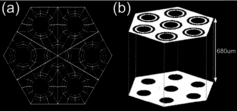
Figure 5. The electric field calculation setup in which the guard-ring surface is on the (a) topside and (b) backside. (c) is the normal G-GEM (no guard ring) as a reference. With each setup (a) and (b), we can see that a high electric field forms inside the center G-GEM hole. The colored lines represent the equipotential lines. Red and blue lines indicate the high and low potentials, respectively. The high potentials are around the backside, and the low potentials are around the topside.
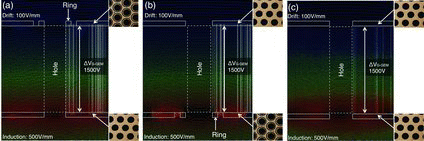
Figure 6. The guard-ring surface on the (a) topside and (b) backside.
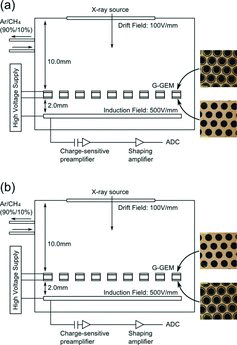
Figure 7. The gain curve of the topside (circles) and backside (squares) guard-ring setup. The horizontal axis is the applied voltage between the G-GEM topside and backside. The vertical axis is the effective gas gain.
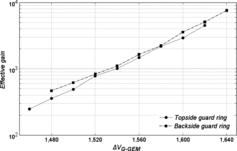
Figure 8. (a) Topside guard-ring setup showing the energy spectrum of the 55Fe uniform irradiation. The energy resolution was 22.4% (FWHM) at a gain of approximately 1480. (b) Backside ring setup showing the 60 μm square collimated beam (red circles) and 55Fe uniform irradiation (black x-marks). The resolutions were 17.3 and 23.4% (FWHM) at gains of approximately 2700 and 6300, respectively.
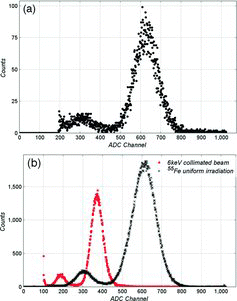
Figure 9. The gas gain of the (a) topside and (b) backside guard ring during the period between 10 to 12 h from the start of the test. The case (a) was tested with 55Fe source (about 164 kBq), and the case (b) was tested using a collimated beam (850 cps at 60 μm square area).
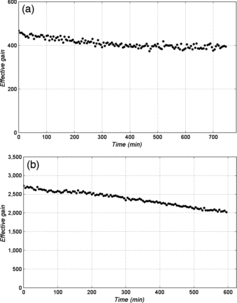
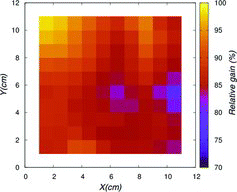
Figure 10. The gain uniformity of the guard ring G-GEM.