Figures & data
Figure 1. Schematics of event sequences for CDA.
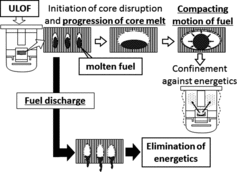
Figure 2. Concept of FAIDUS designs.
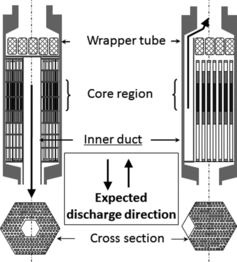
Figure 3. Schematic of experimental devices for out-of-pile series tests.
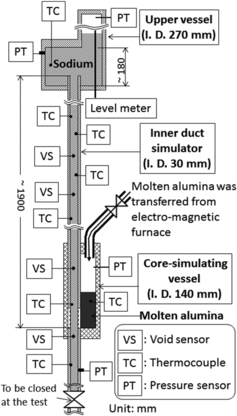
Table 1. Initial conditions for out-of-pile tests.
Figure 4. Schematic of the experimental device for the in-pile test.
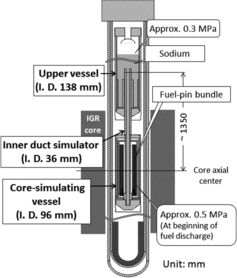
Figure 5. Realized energy insertion history.
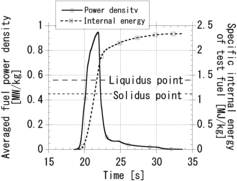
Figure 6. Sensors arrangement and measured data in test 3.
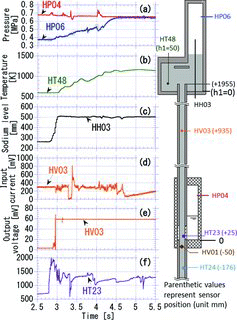
Figure 7. Measured data below the core-simulating vessel in test 3.
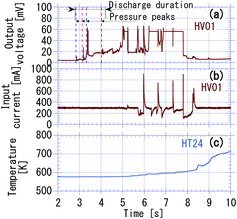
Figure 8. Solidified alumina distributions after test 3.
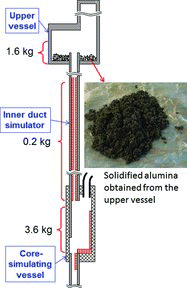
Table 2. Summary of the experimental results.
Figure 9. An interpreted sequence of the upward melt discharge.
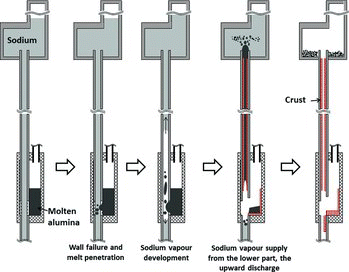
Figure 10. Measured data in the in-pile test.
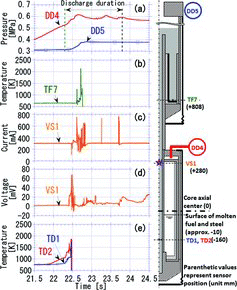
Figure 11. Power transient used to evaluate the required flow rate of molten fuel.
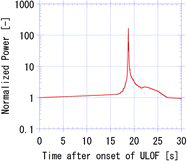
Figure 12. Model to evaluate the required flow rate of molten fuel.
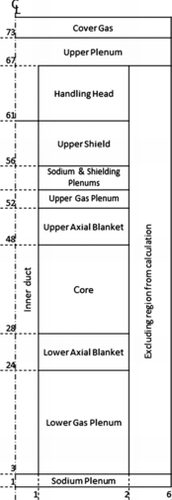
Figure 13. Required flow rates for molten fuel through the inner duct and the time difference between failures of the wrapper tube and the inner duct.
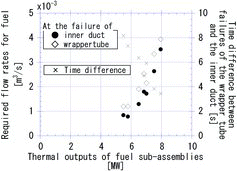
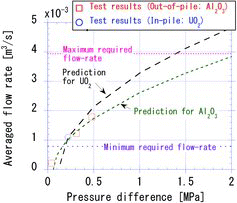
Figure 14. Average flow rates predicted from the out-of-pile and in-pile tests.
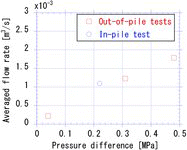
Figure 15. Prediction of average flow rates to supposed CDA conditions.