Figures & data
Figure 1. Conceptual diagram of a PWR spent fuel pit.
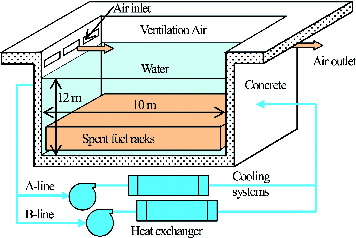
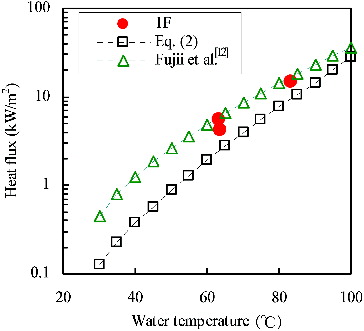
Figure 2. Evaporation heat fluxes calculated by Equations (1) and (2).
Figure 3. Increase of water temperature during the shutdown of cooling systems.
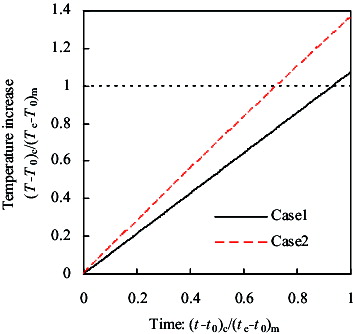
Figure 4. Heat transfer model for loss of all AC power supplies.
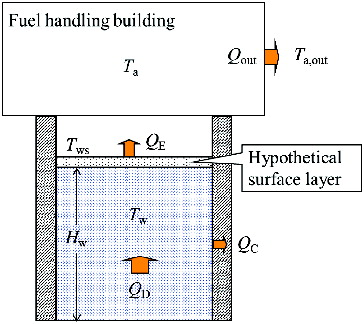
Table 1. Calculation conditions [Citation5].
Figure 5. Transient behavior after loss of all AC power supplies (Unit 4 pool, intact building).
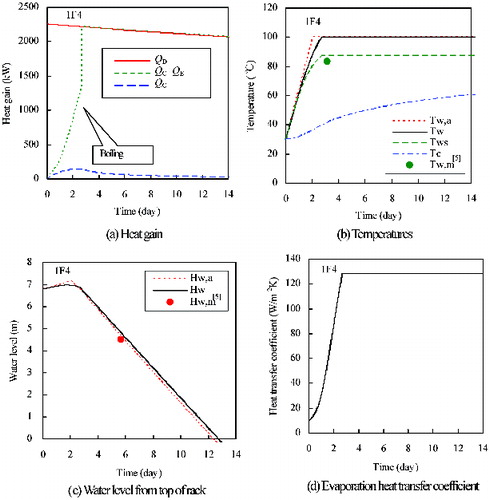
Figure 6. Transient behavior after loss of all AC power supplies (Unit 4 pool, damaged building).
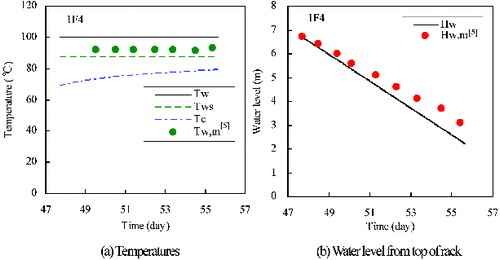
Figure 7. Water level (Unit-4 pool, damaged building, 0.8 QD).
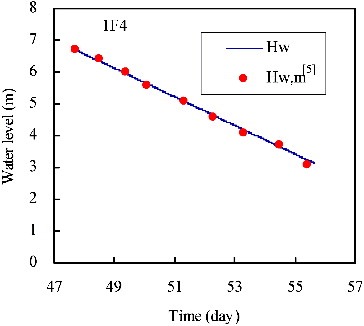
Figure 8. Transient behavior after loss of all AC power supplies (Unit 2 pool, intact building, without water injection).
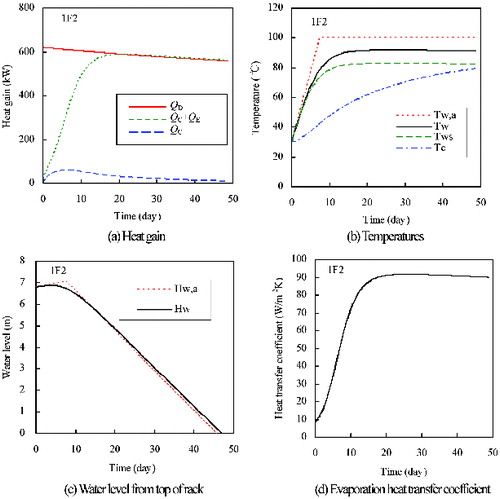
Figure 9. Transient behavior after loss of all AC power supplies (Unit 2 pool, intact building, with water injection).
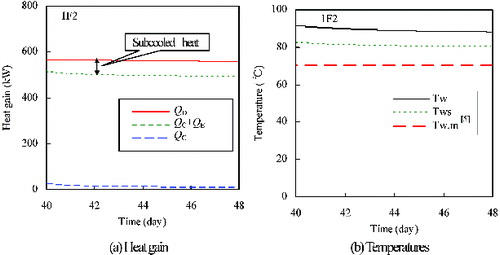
Figure 10. Effects of decay heat (QD) and evaporation heat flux (qE) on water temperatures (Unit 2 pool).
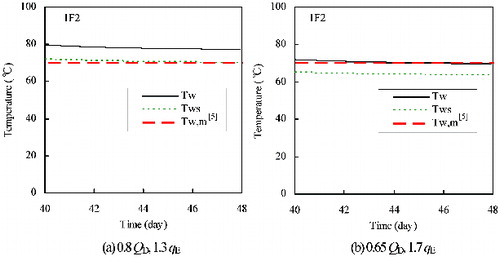
Figure 11. Effects of decay heat (QD) and evaporation heat flux (qE) (Unit 2 pool, 0.8 QD, 2.3 qE).
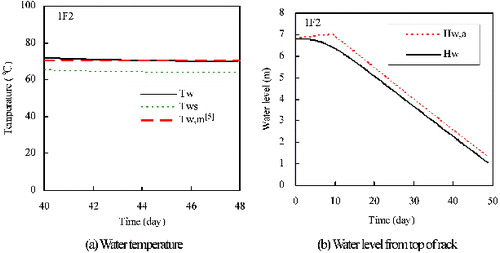
Figure 12. Water temperatures (Unit 4 pool, damaged building, 0.8QD, 1.55qE).
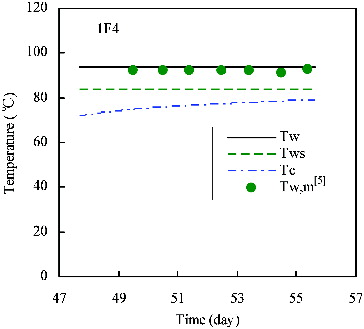
Figure 13. Comparison of evaporation heat fluxes.