Figures & data
Figure 1. Overview of the calculation procedure of LI correction technique with SPH factor and DF.
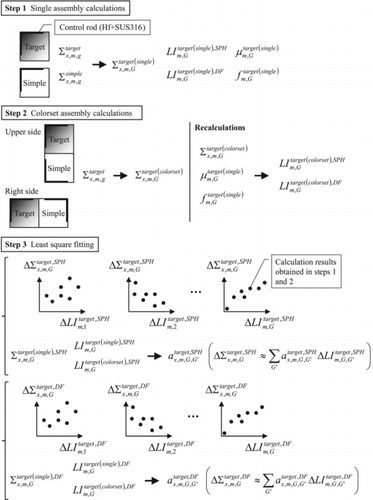
Figure 2. 8×8 BWR fuel assemblies used in present study.
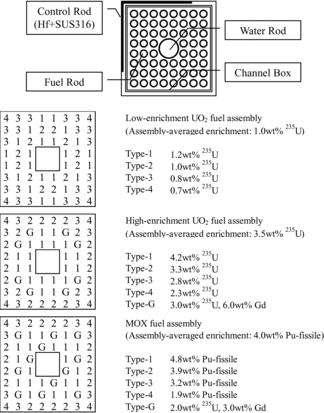
Table 1. Energy group structure.
Figure 3. Geometry of 4×4 colorset assemblies.
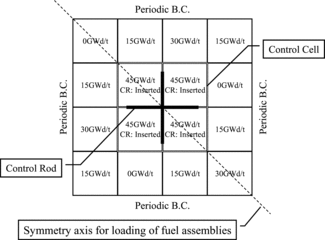
Figure 4. Treatments of spatial and energy dependences in lattice physics and core calculations.
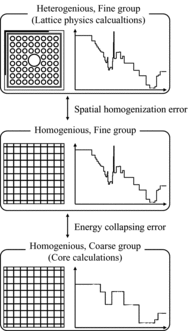
Table 2. Types of calculation results used in the present verifications.
Table 3. Summary of 4-group calculation results considering errors due to spectral interference effect and energy collapsing.
Table 4. Summary of 8-group calculation results considering errors due to spectral interference effect and energy collapsing.
Table 5. Summary of 4-group calculation results only considering spectral interference effect in previous study [Citation6].
Table 6. Summary of 8-group calculation results only considering spectral interference effect in previous study [Citation6].
Table 7. Breakdown of calculation errors by LI correction technique, SPH factor, and DF in 4-group.
Table 8. Breakdown of calculation errors by LI correction technique, SPH factor, and DF in 8-group.
Figure 5. Geometry of 2×2 colorset assemblies.
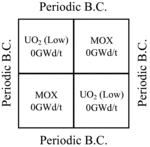
Figure 6. Difference of pin-by-pin fission rate distribution (Cases 1 and 2).
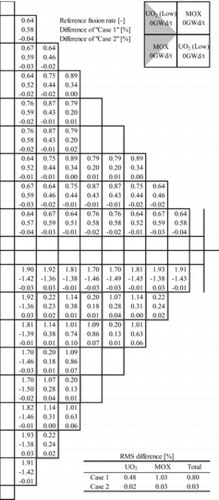
Figure 7. Difference of pin-by-pin fission rate distribution (Cases 3 and 4).
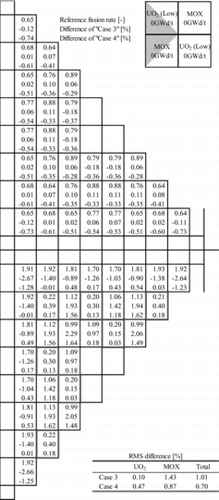
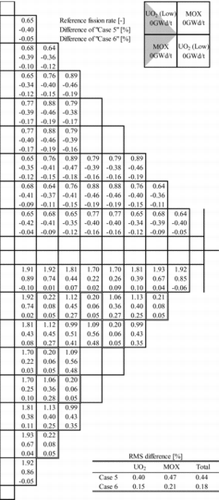
Figure 8. Difference of pin-by-pin fission rate distribution (Cases 5 and 6).