Figures & data
Figure 1. Meshes, sub-cell divisions, and unknown variables.
Figure 2. Comparison of the L2-norms of errors versus mesh size.
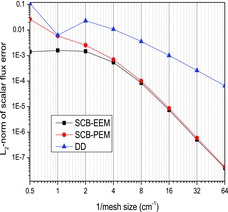
Table 1. Cross sections (cm−1) for the two-group heterogeneous problem.
Figure 3. Configuration and sources of the two-group heterogeneous test problem.
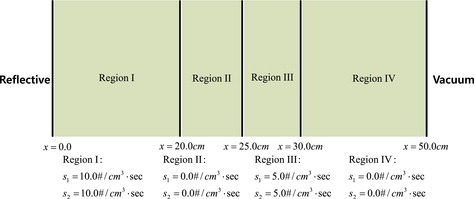
Table 2. Relative errors (%) of the region average scalar fluxes and the scalar fluxes at the right boundary.
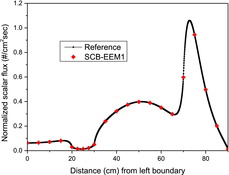
Figure 4. Reference scalar flux distribution for the two-group heterogeneous test problem.
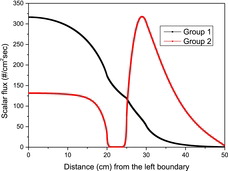
Table 3. Multi-group cross sections (cm−1) for the four-group homogeneous test problem.
Figure 5. Configuration and sources of the four-group test problem.
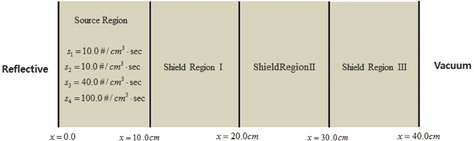
Table 4. Relative errors (%) of the region average fluxes and scalar fluxes at the right boundary for the four-group homogeneous test problem.
Figure 6. Reference scalar flux distributions for the four-group test problem.
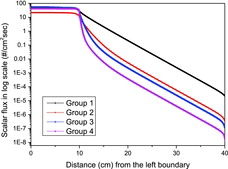
Table 5. Cross sections (cm−1) for the two-group eigenvalue problem.
Figure 7. Configuration of the two-group eigenvalue problem.
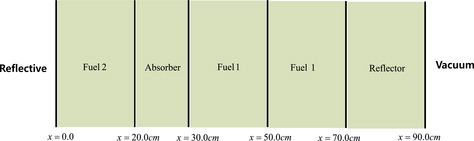
Table 6. Comparison of the eigenvalues for the eigenvalue problem.
Table 7. Comparison of the relative percentage errors of the region-wise scalar fluxes.
Figure 8. Comparison of the scalar flux distributions for the two-group eigenvalue problem (Group 1).
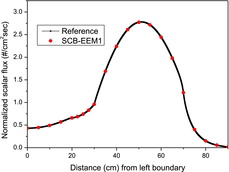
Figure 9. Comparison of the scalar flux distributions for the two-group eigenvalue problem (Group 2).