Figures & data
Figure 1. Three geometries for the MCNP simulations: (1) fractured system I, (2) fractured system II, and (3) homogeneous system.
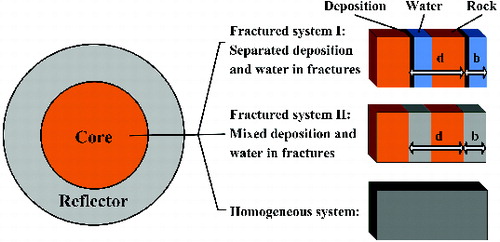
Table 1. Heavy metal compositions at the time of the accident.
Table 2. Heavy metal compositions after 200,000 years of decay.
Table 3. Host rock compositions.
Figure 2. (a) keff contour plot for fractured sandstone with fractured geometry I. (b) keff contour plot for iron-rich rock with fractured geometry I.
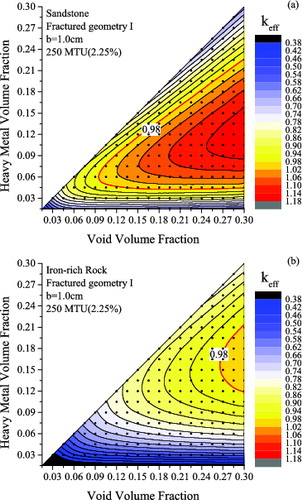
Figure 3. Minimum VVF for keff > 0.98 for different rocks and geometries, assuming all 250 MT of uranium is deposited.
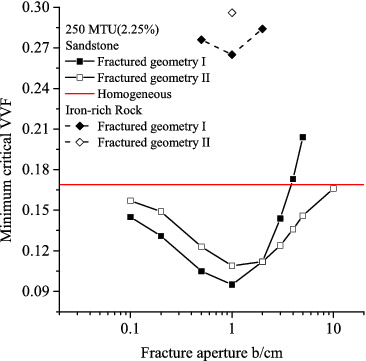
Figure 4. keff for different rock types and heterogeneous geometries with different fracture apertures.
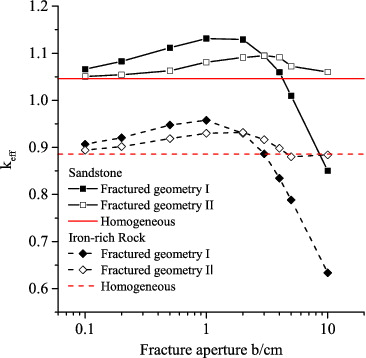
Figure 5. (a) Critical mass contour plot for fractured sandstone. The values in the figure and in the side-bar scale are logarithm of MT of uranium included in the system. (b) Critical mass contour plot for homogeneous sandstone. The values in the figure and in the side-bar scale are logarithm of MT of uranium included in the system.
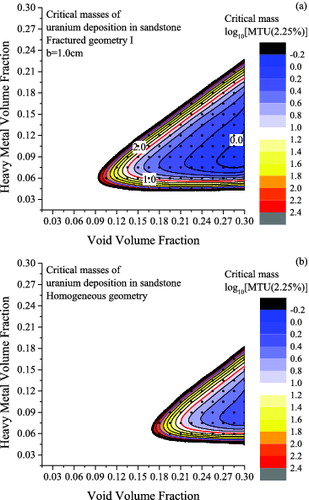
Table 4. Minimum critical void volume fractions (VVF) for various combinations of geometries and uranium deposition masses.
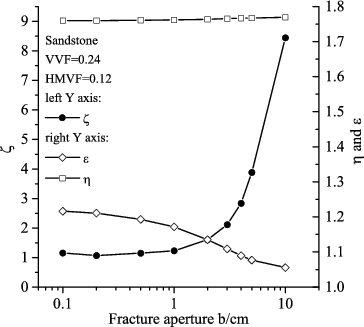
Figure 6. Thermal disadvantage factor, fast fission factor, and thermal reproduction factor for different fracture apertures for fractured system I.