Figures & data
Figure 1. Bird's-eye view of an EM pump.
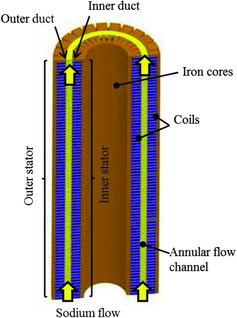
Figure 2. 3D MHD code algorithm.
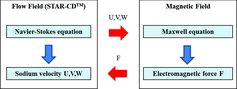
Table 1. ETEC 160 m3/min specifications.
Table 2. Simulation conditions.
Figure 3. ETEC 160 m3/min mesh.
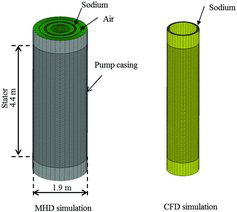
Figure 4. Pressure contour (159 m3/min, 20.4 Hz, 0.5 sec).
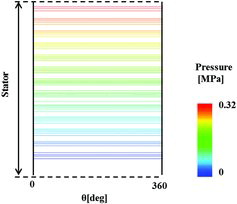
Figure 5. Flow velocity distribution at pump outlet (159 m3/min, 20.4 Hz, 0.5 sec).
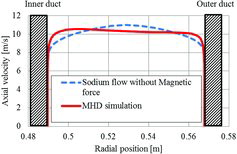
Figure 6. Transient of the developed pressure (159 m3/min, 20.4 Hz).
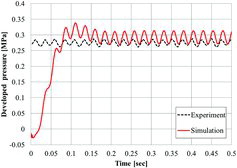
Figure 7. P–Q characteristics: simulations and experiments.
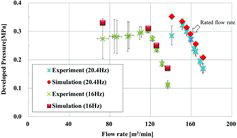
Figure 8. Circumferential non-uniformity of flow velocity in inlet boundary condition.
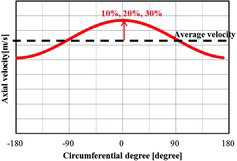
Table 3. Simulation conditions.
Figure 9. Contour of the flow velocity (151 m3/min, Rm × s = 1.4, non-uniformity 10%).
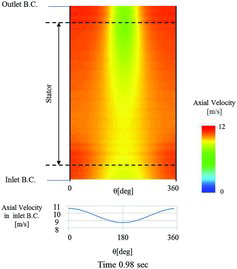
Figure 10. Transient of developed pressure (151 m3/min, Rm × s = 1.4, non-uniformity 10%).
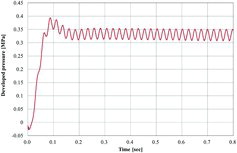
Figure 11. Transient of developed pressure with non-uniformity (141 m3/min, Rm × s = 1.4).
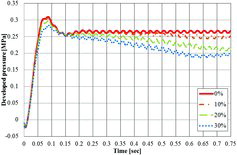
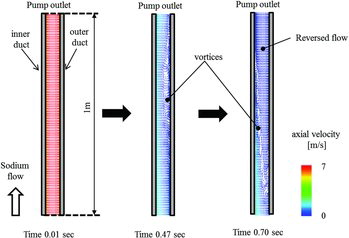
Figure 12. Contours of axial flow velocity (141 m3/min, Rm × s = 1.6, non-uniformity 30%).
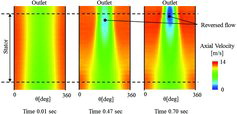
Figure 13. The flow vectors in r–z plane (141 m3/min, Rm × s = 1.6, non-uniformity 30%).