
Figures & data
Table 1. Electron creation statistics when 10,000 electrons with energy 1 MeV are stopped in xenon.
Table 2. Electron loss statistics when 10,000 electrons with energy 1 MeV are stopped in xenon.
Table 3. Photon creation statistics when 10,000 electrons with energy 1 MeV are stopped in xenon.
Table 4. Photon loss statistics when 10,000 electrons with energy 1 MeV are stopped in xenon.
Figure 1. Probability density functions (a) and corresponding cumulative distribution functions (b) of knock-on electrons in neon for two values of the incident electron energy.
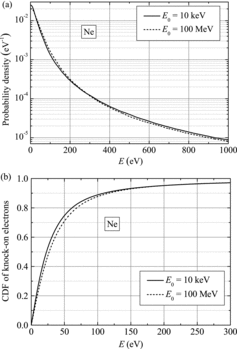
Figure 2. Probability density functions (a) and corresponding cumulative distribution functions (b) of knock-on electrons in xenon for two values of the incident electron energy.
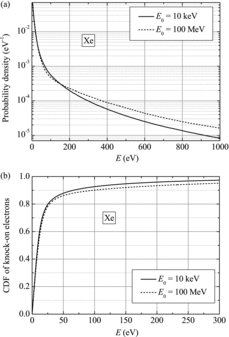
Table 5. Average values of the ratio of excitation and ionization cross sections in the energy range from 40 to 200 eV.
Figure 3. Energy dependence of (a) electroionization and (b) excitation cross section for electrons in neon.
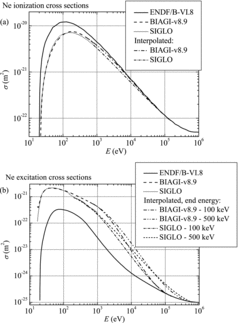
Figure 4. Energy dependence of (a) electroionization and (b) excitation cross section for electrons in xenon.
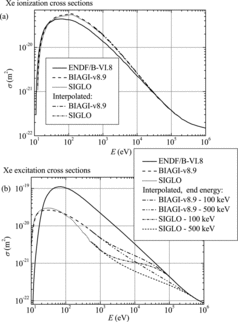
Figure 5. Comparison of calculated values of W for neon: (a) using BIAGI-v8.9 data and (b) using SIGLO data.
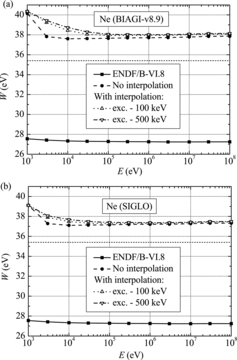
Figure 6. Comparison of calculated values of W for xenon: (a) using BIAGI-v8.9 data and (b) using SIGLO data.
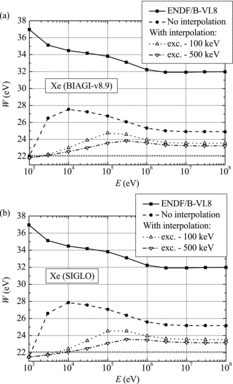
Table 6. Average experimental and calculated values of W (eV) and their standard deviations.