Figures & data
Figure 1. Configuration of SPND.
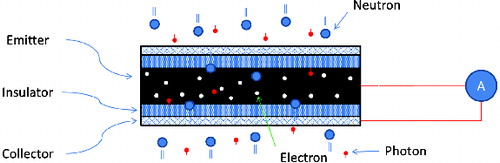
Figure 2. Calculation flow of detector sensitivity.
Table 1. Comparison of calculation models.
Figure 3. Rhodium decay chain.
Figure 4. Cobalt decay chain.
Figure 5. Configuration of SPND calculation model.
Figure 6. Configuration of emitter tally region and initial source distribution for the tally cell 3.
Figure 7. Normalized intensity distributions.
Figure 8. Rhodium composition change during 10.5 years.
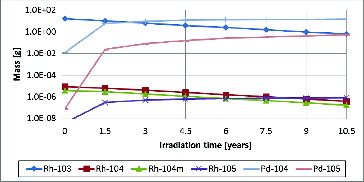
Table 2. SPND specifications.
Table 3. Mono-energy sensitivity calculation results.
Table 4. Mono-energy sensitivity comparison result.
Table 5. Sensitivity comparisons of continuous-energy model and mono energy model.
Table 6. Depletion specification.
Figure 9. Vanadium composition change during 10.5 years.
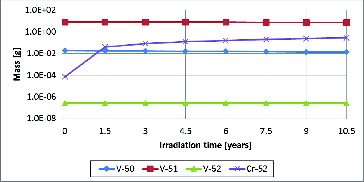
Figure 10. Cobalt composition change during 10.5 years.
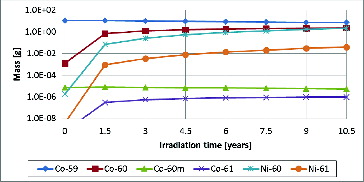
Figure 11. SPND beta intensity fraction.
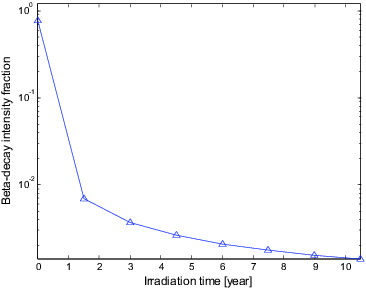
Figure 12. SPND depletion calculation results during 10.5 years.
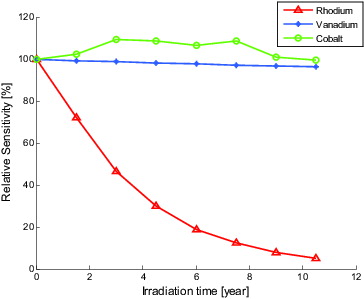
Figure 13. Sensitivity of cobalt SPND during 10.5 years.
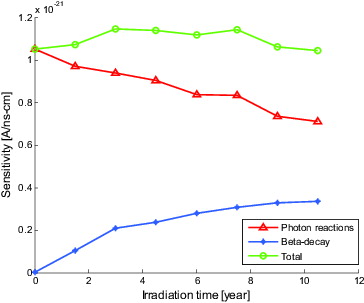
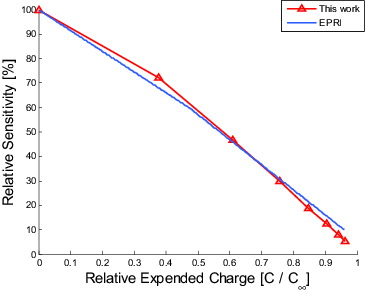
Figure 14. Rhodium SPND sensitivity depletion comparisons.