Figures & data
Table 1. Different information quantity of CBP interfaces.
Figure 1. The layout of presentation style used in this experiment. (A) High information quantity; (B) low information quantity; and (C) medium information quantity.
Table 2. The difference between complex and simple task.
Figure 2. Interface of the experiment platform (information quantity: medium; task: complex).
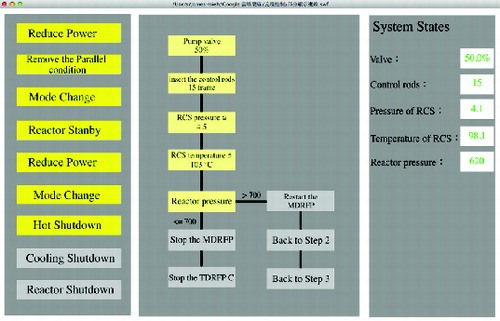
Table 3. The MANOVA results of this experiment.
Table 4. The results of post hoc test for each dependent variable.
Figure 3. The interval plot for operation time.
Figure 4. The integrated results of workload and secondary task performance.
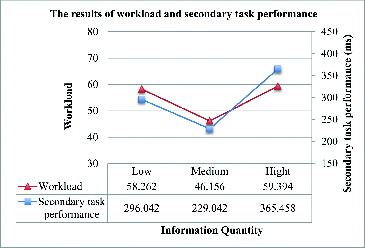
Figure 5. The inverted-U relationship between information quantity and performance.
Table 5. T-test result of separate operation time.
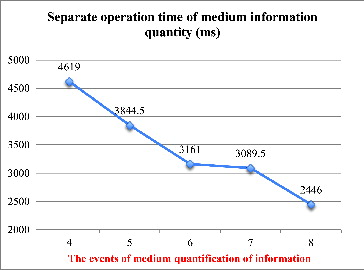
Figure 6. The separate operation time of medium quantification of information.