Figures & data
Figure 1. Number of operational responses to fuel leaks per year conducted at (a) PWRs and (b) BWRs in Japan [Citation5].
![Figure 1. Number of operational responses to fuel leaks per year conducted at (a) PWRs and (b) BWRs in Japan [Citation5].](/cms/asset/fb06a73a-5e14-4268-bc99-e465552ed30d/tnst_a_979901_f0001_oc.jpg)
Figure 2. Schematic representations of the methodology of (a) seismic PRA [Citation12] and (b) the present study.
![Figure 2. Schematic representations of the methodology of (a) seismic PRA [Citation12] and (b) the present study.](/cms/asset/7720d5ec-cfea-401a-8aa2-589df218d0bb/tnst_a_979901_f0002_oc.jpg)
Figure 3. Equivalent hazard curve representing the occurrence frequency of leak events as a function of the leakage of I-131 per event.
Table 1. Parameter values used in the present calculations.
Figure 4. Time evolution of I-131 concentration in the primary coolant water.
Figure 5. Time evolution of the concentration of I-131 in the primary coolant water for the cases of (a) high frequency condition and (b) low frequency condition.
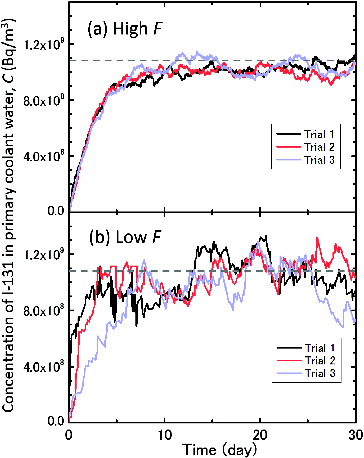
Figure 6. An example of calculations, which represents the time evolution of I-131 concentration when the water sampling is conducted once a week. The critical concentration is given as indicated by the horizontal dashed line. In this case, the fuel replacement is observed to be performed at just after seven weeks, when the concentration is set to be zero, followed by a subsequent calculation trial.
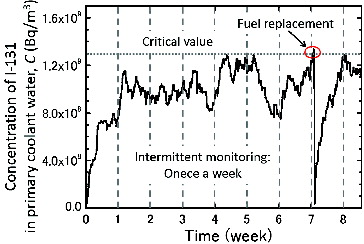
Figure 7. A double logarithmic plot of the equivalent hazard curve for fuel leaks.
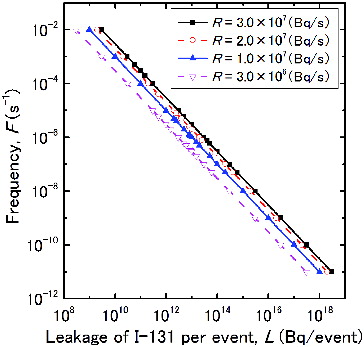
Figure 8. Frequency of unscheduled immediate reactor shutdown due to fuel leaks for various leak rates, R.
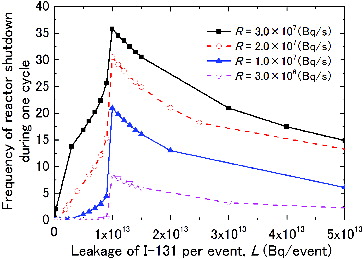
Figure 9. Equivalent fragility curve for fuel leaks obtained by the Monte Carlo calculations. The fuel leak event is considered to be almost a threshold phenomenon.
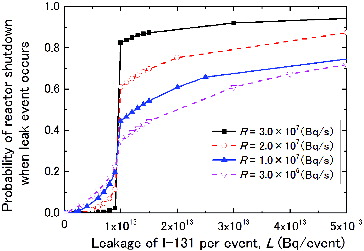
Figure 10. Shutdown frequency curves when the critical value of I-131 concentration was changed.
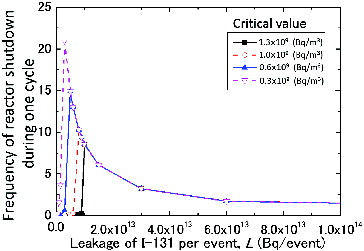
Figure 11. Frequency of immediate reactor shutdown for a fixed value of the leak rate, R = 3×10⁶ Bq/s, when the time interval of intermittent monitoring is changed from one day to one month.
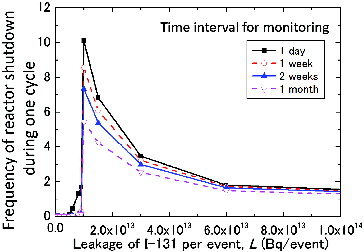
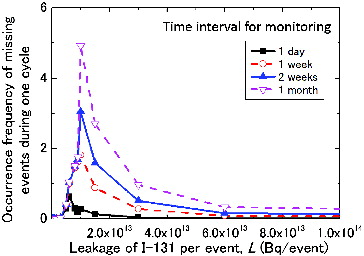
Figure 12. Frequency of the occurrence of such an event that the fuel replacement is really required but unfortunately missed.