Figures & data
Table 1. Chemical composition of the Hastelloy-N alloy.
Figure 1. Metallography of Hastelloy-N alloy: (a) before heat treatment and (b) after heat treatment.
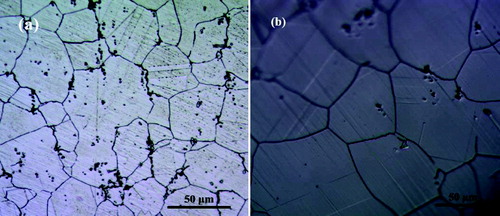
Table 2. Irradiation conditions at the Institute of Modern Physics.
Figure 2. Damage rate and Xe deposition with Xe+ implantation depth calculated by SRIM: black line represents the damage rate for high dose rate (1.3×10⁻³ dpa/s) and red line represents the damage rate for low dose rate (3.0×10⁻⁴ dpa/s).
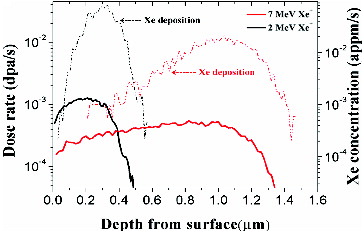
Figure 3. Hardness versus indentation depth for Hastelloy-N alloy.
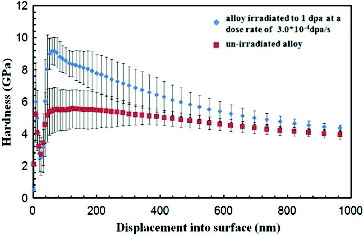
Figure 4. TEM micrograph of Hastelloy-N alloy: (a) before implantation and (b) irradiation with 7 MeV Xe+ at 0.5 dpa.
Figure 5. Hardness of alloy as a function of irradiation dose at different dose rates.
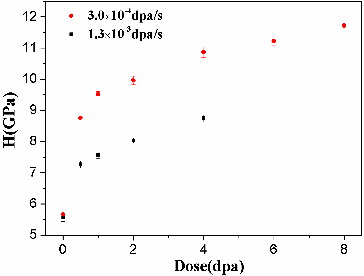
Figure 6. S-parameter as a function of depth in the alloys irradiated with different dose.
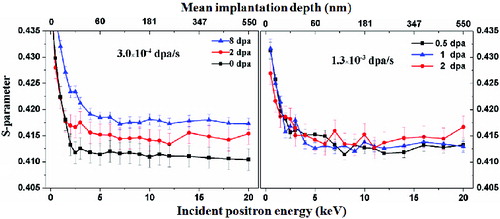
Table 3. Number density and mean size of defects at the different irradiation conditions.
Figure 7. TEM micrograph of Hastelloy-N alloy irradiated by different Xe ion doses with a low dose rate. (a) Magnified image of region A of (b).
Figure 8. TEM micrograph of Hastelloy-N alloy irradiated by different Xe ion doses with a high dose rate.
Figure 9. Hardness of alloy (irradiation with 7 MeV Xe+) as a function of the average S-parameter (in depth from 50 nm to 150 nm).
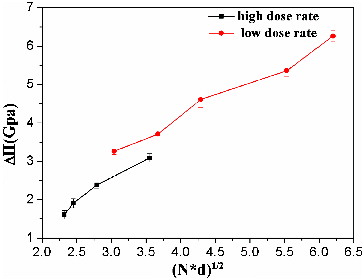
Figure 10. Hardness as a function of average obstacle spacing.