
Figures & data
Figure 1. Mass of HLW and SNF per GWe-yr with the composition at 10 years after discharge.
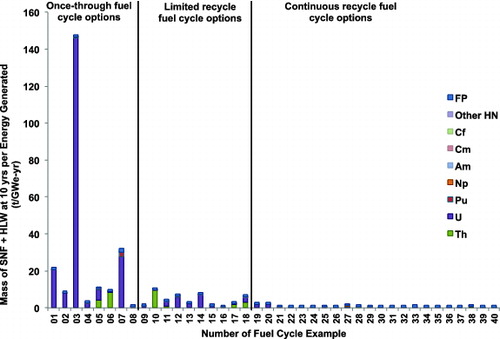
Figure 2. SNF+HLW activity of 40 fuel-cycle examples at 10, 100 and 100,000 years.
Table 1. Comparison of the values of the SNF+HLW management parameters calculated for the 40 fuel-cycle examples.
Figure 3. Time evolution of the contributors to SNF+HLW activity averaged over the 40 fuel-cycle examples.
Figure 4. Comparison of the effective ingestion and inhalation dose conversion factors.
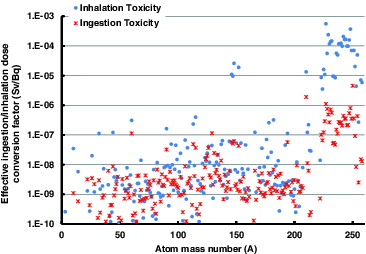
Figure 5. Contributions to SNF+HLW activity at 10 years after discharge.
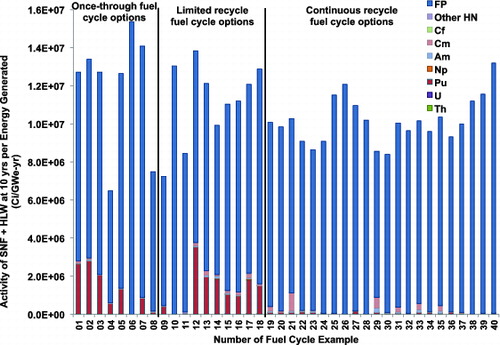
Figure 6. Specific activity of the fission products 10 years after discharge.
Figure 7. Comparison of fission products activities after 10-year cooling following fission of U-233, U-235 and Pu-239 in fast and thermal spectra.
Figure 8. Contributions to SNF+HLW inhalation toxicity at 10 years after discharge.
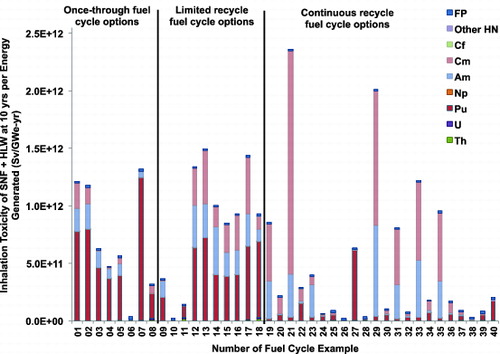
Figure 9. Contributions to SNF+HLW ingestion toxicity at 10 years after discharge.
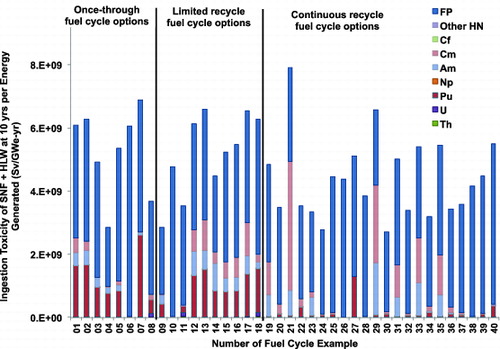
Figure 10. Contributions to SNF+HLW decay heat at 10 years after discharge.
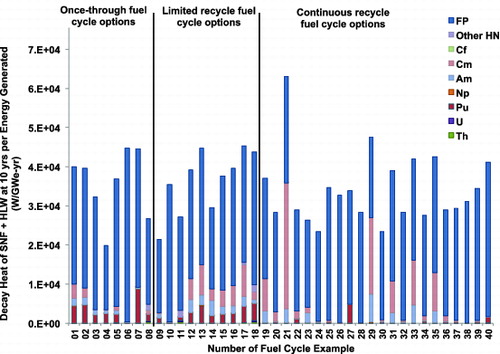
Figure 11. Contributions to SNF+HLW activity at 100,000 years after discharge.
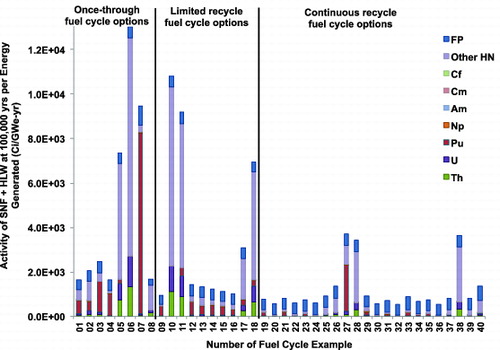
Figure 12. Comparison of the main isotopic components of activity 100,000 years after discharge from decay daughters of U-233, U-234 and Pu-239.

Figure 13. Contributions to SNF+HLW inhalation toxicity at 100,000 years after discharge.
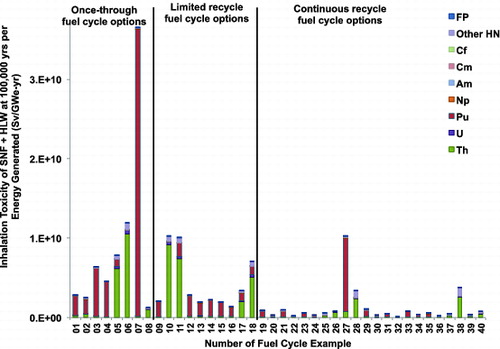
Figure 14. Contributions to SNF+HLW ingestion toxicity at 100,000 years after discharge.
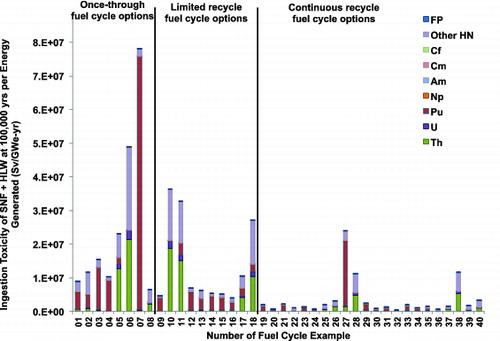
Table 2. Variations in mass and activity of HLW with separation efficiency for fuel-cycle example 32.
Figure 15. Activity of SNF+HLW for fuel-cycle example 32 with different separation efficiency values.
Figure 16. Inhalation toxicity of SNF+HLW for fuel-cycle example 32 with different separation efficiency values.
Appendix 1. Summary descriptions of the 40 fuel-cycle examples.