Figures & data
Figure 1. (a) Schematic diagram of the capillary-based microfluidic device; (b1)–(b7) snapshots of the droplet formation at the outlet of the capillary tube (flow rate of continuous phase: 150 µL min−1, flow rate of dispersed phase: 5 µL min−1).
Figure 2. Procedure for fabricating Li2TiO3 pebbles.
Table 1. Composition of the solution used in this study.
Figure 3. Optical micrographs of the microspheres: (a) Li2TiO3 droplets produced by the capillary-based microfluidic device (flow rate of continuous phase: 150 µL min−1, flow rate of dispersed phase: 5 µL min−1); (b) the biggest Li2TiO3 droplet (flow rate of continuous phase: 150 µL min−1, flow rate of dispersed phase: 10 µL min−1) and smallest droplet (flow rate of continuous phase: 180 µL min−1, flow rate of dispersed phase: 1 µL min−1); (c) small Li2TiO3 pebbles after sintering at 950 °C for 3 hours; (d) big Li2TiO3 pebbles after sintering at 950 °C for 3 hours.
Figure 4. TG-DSC curves of the dried Li2TiO3 green pebble in air atmosphere.
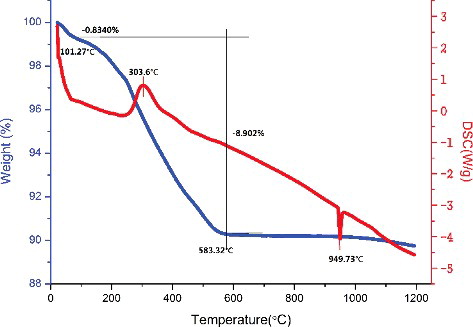
Figure 5. Relationship between sintering temperature (a) and sintering time (b) (the sintering temperature was 950 °C) with Li2TiO3 pebbles density.
Figure 6. Effect of solid content of slurry on the density of Li2TiO3 pebbles (the sintering temperature was 950 °C and the sintering time was 3 hours).
Figure 7. Relationship between particle size of Li2TiO3 powder with Li2TiO3 pebbles density (the sintering temperature was 950 °C, the sintering time was 3 hours and the content of Li2TiO3 powder was 35 wt%).
Figure 8. XRD pattern of the prepared Li2TiO3 pebbles.
Figure 9. SEM micrographs of sintered Li2TiO3 pebbles: (a) surface of Li2TiO3 pebbles sintered at 950 °C; scale bar is 200 µm; (b)--(d) cross section of Li2TiO3 pebbles sintered at 950 °C, 1050 °C and 1150 °C; scale bar is 30 µm.