
Figures & data
Figure 1. Presentation of the French “BUC” calculation route when ICFs are applied.
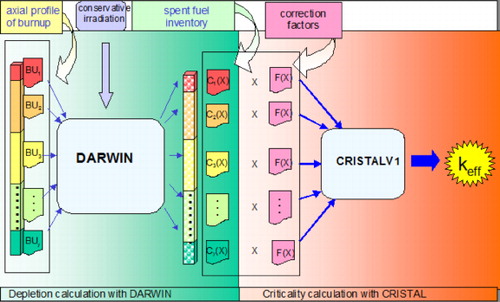
Figure 2. The DARWIN2 depletion package.
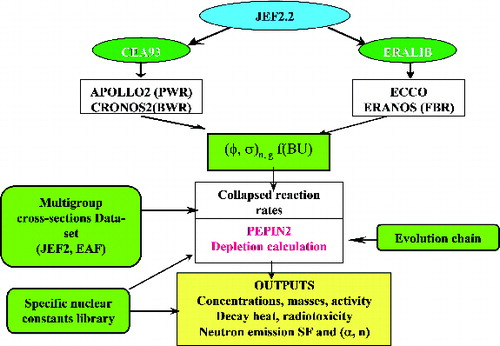
Figure 3. The CRISTAL V1 criticality package.
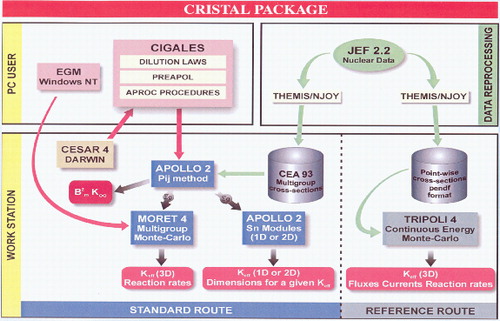
Figure 4. Sectional view of UO2 assemblies in the TN® 24 E (1/8 symmetry).
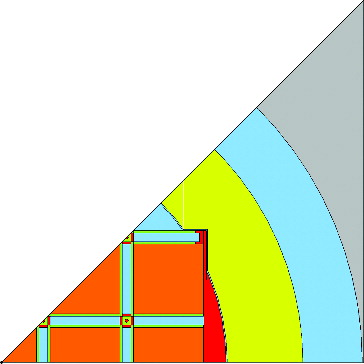
Figure 5. Sectional view of UO2 assemblies in the TN® 24 E cask and the burnup profile.
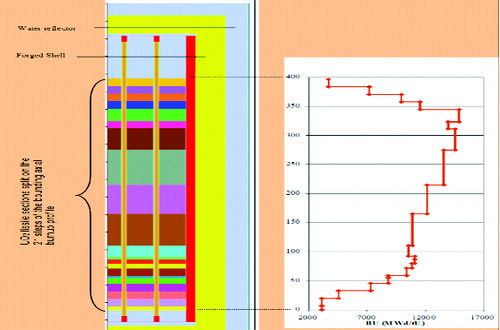
Table 1. French BUC PIE database.
Figure 6. 235U calculation–experiment deviation from French PIE: linear trend in [C/E − 1] − 2σ versus burnup.
![Figure 6. 235U calculation–experiment deviation from French PIE: linear trend in [C/E − 1] − 2σ versus burnup.](/cms/asset/4b01fa74-076c-4486-b53a-eca864266e51/tnst_a_1037808_f0006_oc.jpg)
Table 2. Isotopic correction factors applied to the TN® 24 E cask area of application with the BUC nuclides concentrations calculated with DARWIN2.0 for criticality.
Figure 7. APOLLO2 calculation pattern for FP oscillation experiments in MINERVE.
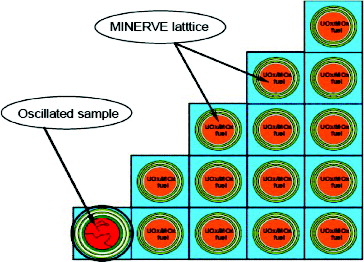
Table 3. Calculation – experiment bias of each fission product reactivity worth in R1-UO2 with CRISTAL V1.0.
Table 4. Isotopic correction factors associated with each BUC fission product reactivity worth applied to the TN® 24 E cask.
Table 5. keff-penalty terms for the TN® 24 E cask loaded with 21 used fuel assemblies at 12 GWd/tHM.