
Figures & data
Figure 1. A group-wise calculation strategy for calculating .
![Figure 1. A group-wise calculation strategy for calculating cov [ST,SMC‾].](/cms/asset/68ce2ed8-48dd-4f44-bf81-0d498a5b9490/tnst_a_1038665_f0001_oc.jpg)
Figure 2. Radial views of the benchmark problems.
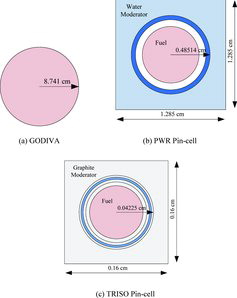
Table 1. Details of the benchmark problems used in this study.
Table 2. Monte Carlo simulation conditions of the benchmark problems for S/U analysis.
Figure 3. Uncertainty results of responses (keff) with 95% confidence intervals as the number of cross section sets is increased.
Figure 4. Uncertainties of keff responses with 95% confidence intervals for each problem case.
Table 3. Results of the standard deviation and standard error with the proposed method.