Figures & data
Figure 1. X-ray diffraction (XRD) patterns of UO2–ZrO2 samples with different UO2/ZrO2 ratios after heat treatment at 1473 K in Ar + 10% H2 for 1 h. Circles represent UO2 solid solution (s.s.), and triangles represent t-ZrO2.
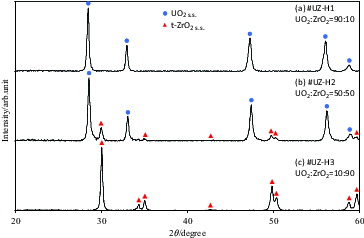
Figure 2. X-ray diffraction (XRD) patterns of UO2–ZrO2 samples with different UO2/ZrO2 ratios after heat treatment at 1473 K in N2+2% O2 for 1 h. Diamonds represent U3O8, squares represent t-ZrO2, and triangles represent m-ZrO2.
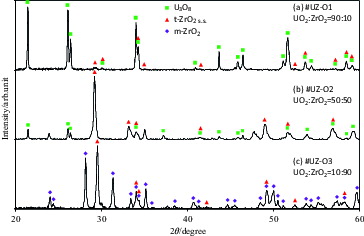
Table 1. Properties of solid solution samples: major phase conditions, initial inventory of nuclides Ai, and the half-life and the energy of peaks assigned.
Figure 3. Time dependence of the uranium molar concentration after filtration through a 0.45-μm-pore-size membrane in seawater (left) and Milli-Q water (right).
Figure 4. Uranium molar concentrations after filtration through 3 kDa and 0.45-μm-pore-size membranes.
Figure 5. Typical gamma ray spectra measured for the filtrate of #U-O (15 d of leaching in seawater), which was passed through the 0.45-μm membrane. The characteristic gamma ray emitters for quantification are marked above the corresponding peaks with underlining.
Figure 6. Leaching ratio RM of the radionuclides and uranium leached in seawater after 15 d.
Figure 7. Time dependence of RM/RU in the seawater sample system; #U-O and #UZ-O series (upper) and #U-H and #UZ-H series (lower).
Figure 8. Time dependence of the leaching ratio RNp normalized by that of RU in the seawater samples.
Figure 9. Radioactivity concentration after filtration through 3 kDa and 0.45-μm-pore-size membranes in the seawater samples after 15 d.