Figures & data
Table 1. The beam parameters of the TBD.
Figure 1. Mechanical design of the first slit.
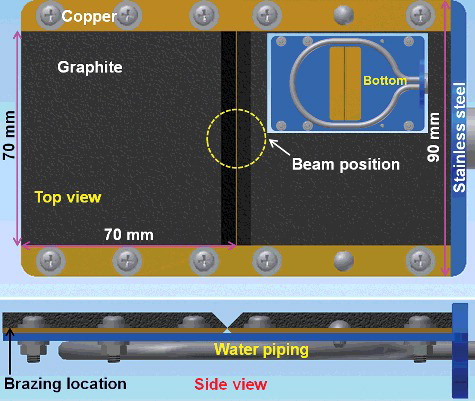
Table 2. Thermo-mechanical properties of materials relevant for the first slit.
Figure 2. Temperature-dependent thermal properties of the materials relevant for the first slit.
Figure 3. Stopping power of 21.67-MeV proton incident on graphite as a function of the penetration depth.
Figure 4. Proton range in graphite vs. the incident energy.
Figure 5. Exponential fit for the stopping power vs. the penetration depth.
Figure 6. Simulated proton trajectories by TRIM for 21.67-MeV point-like proton beam penetration in graphite.
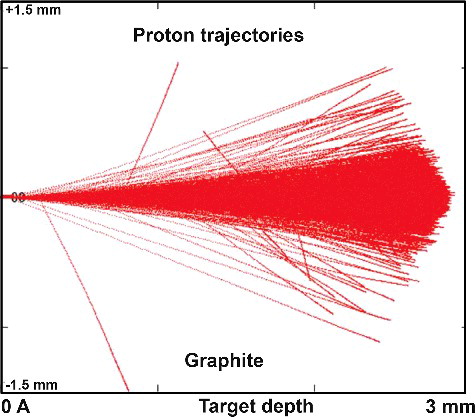
Figure 7. Transverse distribution of point-like proton beam at various depths in graphite: (a) 0.01 mm, (b) 1 mm, (c) 2 mm, (d) 2.7 mm.
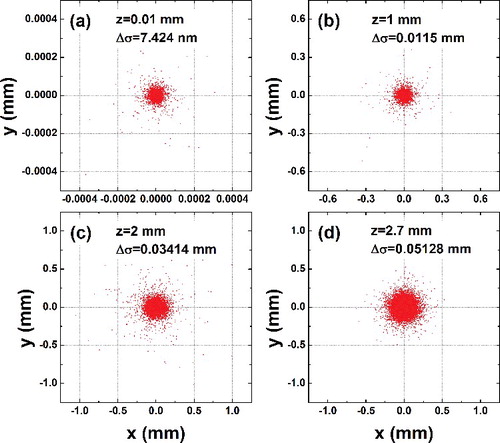
Figure 8. Temperature contour plots at time of (a) 1.8001 s, (b) 2.0 s, and thermal stress contour plots at time of (c) 1.8001 s, (d) 2.0 s.
Figure 9. Longitudinal distribution across the beam center of (a) temperature and (b) thermal stress at the end of the 10th beam pulse.
Figure 10. Time evolution of the normal stress at the BP location.
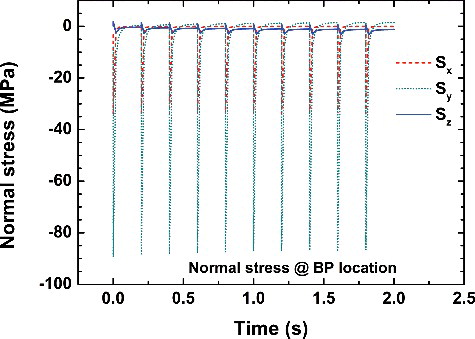
Figure 11. Variation of (a) temperature and (b) VM stress at the BP location and beam center on graphite surface with time.
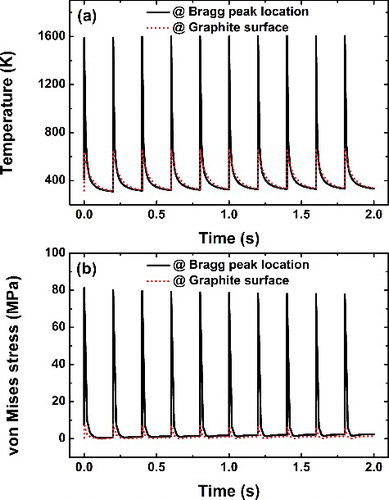
Figure 12. Peak temperature and thermal stress for different beam center locations.
Figure 13. Influences of (a) beam pulse width and (b) beam repetition rate on the peak temperature and VM stress.