
Figures & data
Figure 1. Design concepts of BigT-AHR.
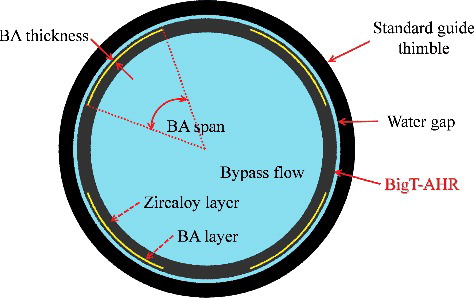
Figure 2. The representative BigT-loaded 17 × 17 fuel assembly lattice.
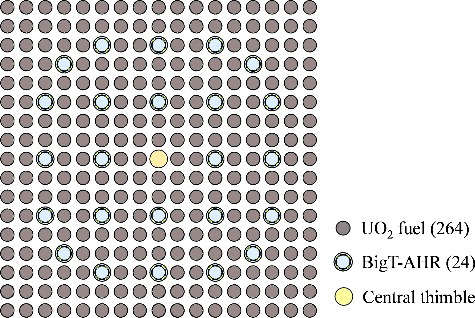
Figure 3. Fuel, BA and clustered bank rodding patterns of 1/8th reference AP1000 first core.
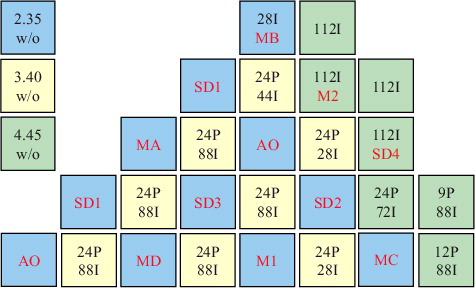
Table 1. AP1000 reactor core design parameters [Citation4].
Table 2. The reference assemblies and neutronically similar BigT-AHR configurations.
Figure 4. The selected fuel assembly reactivity depletion patterns of the reference against the neutronically similar BigT-loaded designs.
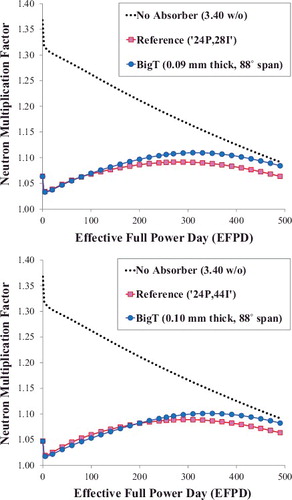
Figure 5. Top view (top) and side view (bottom) of the high-fidelity Monte Carlo simulation AP1000 core model.
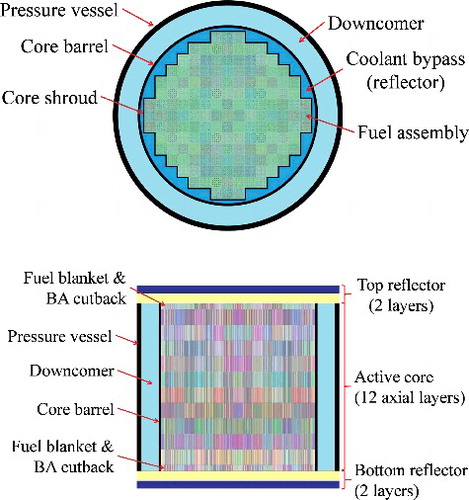
Figure 6. Reactivity depletion of reference core against the BigT-loaded AP1000 first core.
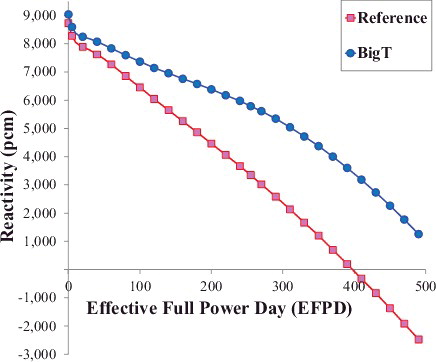
Figure 7. Burnup-dependent radial assembly-wise power peaks of the AP1000 first core designs.
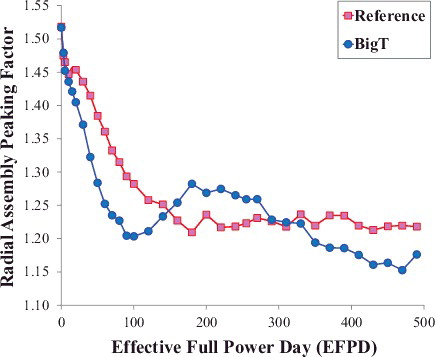
Figure 8. Normalized assembly power of 1/8th reference (top) and BigT-loaded (bottom) AP1000 first cores.
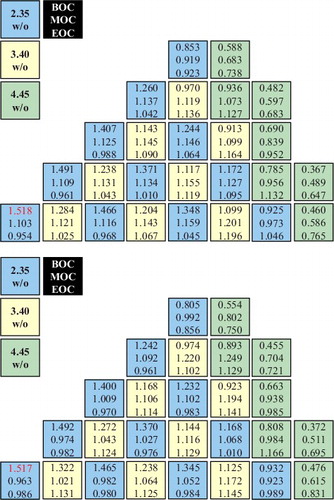
Figure 9. Normalized pin power of 1/8th hottest assembly (central lattice).
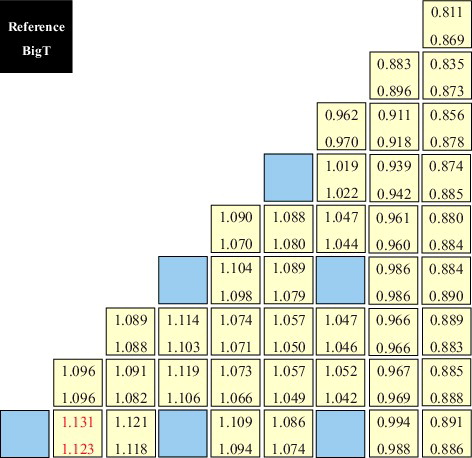
Figure 10. Burnup-dependent axial power peaks of the AP1000 first core designs.
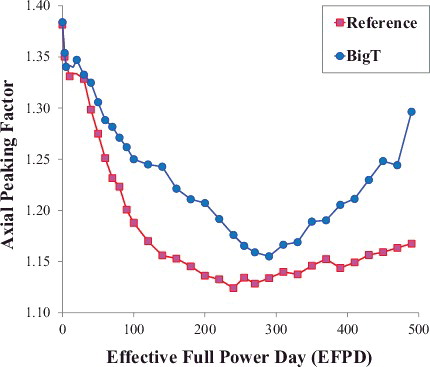
Figure 11. Normalized axial power distributions along active height at 0 (top), 255 (middle) and 490 (bottom) EFPDs.
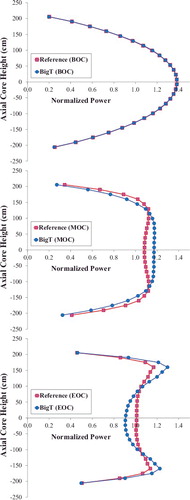
Table 3. BOC shutdown margin estimations of the AP1000 first cores.