Figures & data
Figure 1. Test section.
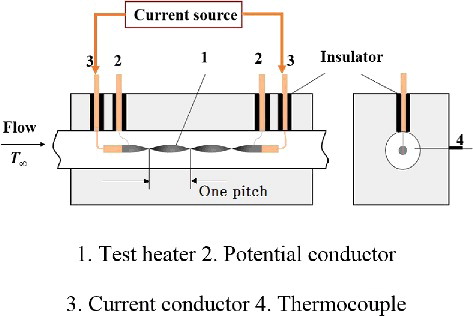
Table 1. Experimental conditions.
Figure 2. Time dependence of , q and ΔT at 10 m/s.
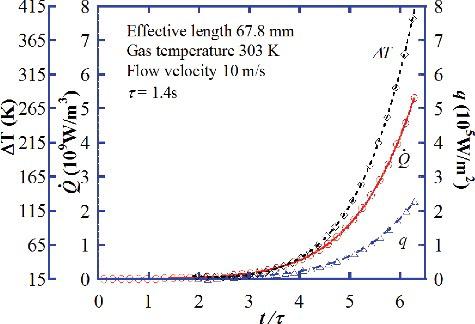
Figure 3. Effect of length on heat transfer coefficient at various periods.
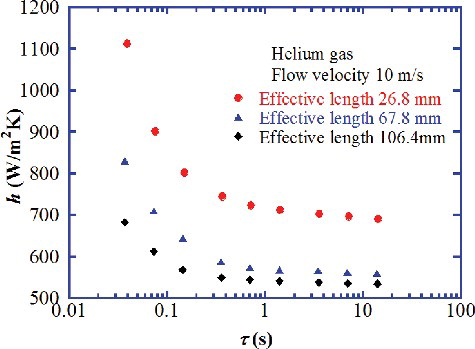
Figure 4. Effect of flow velocity on heat transfer coefficient at various periods.
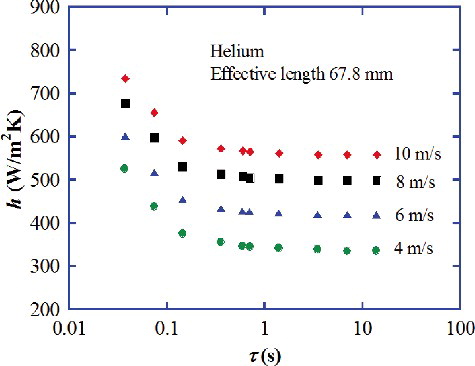
Figure 5. Helical flow length for twisted plate.
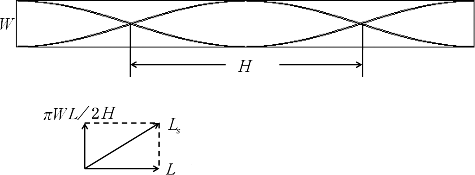
Figure 6. Quasi-steady-state heat transfer at various swirl parameters.
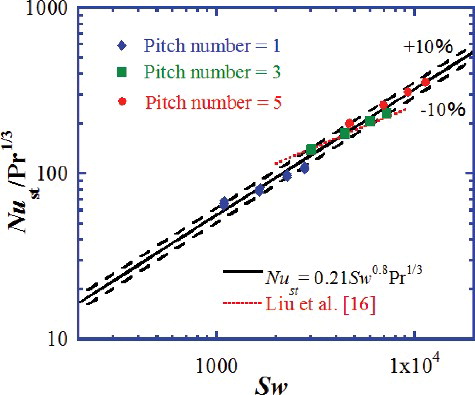
Figure 7. Transient heat transfer for twisted plate at various flow velocities and periods.
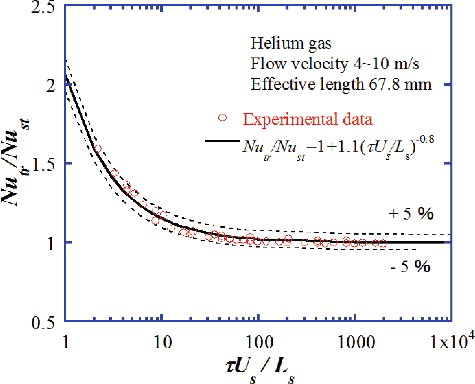
Figure 8. Three-dimensional physical model.
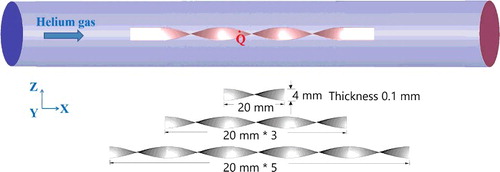
Table 2. Calculating conditions.
Figure 9. Comparison of Q, q and ΔT with experimental data at various periods. (a) , (b) q and (c) ΔT.
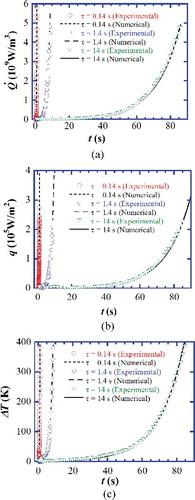
Figure 10. Comparison of simulation results with experimental data at various flow velocities.
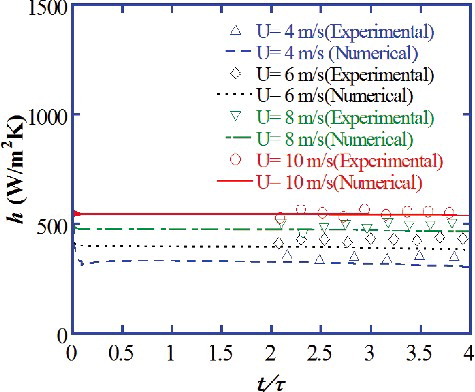
Figure 11. Comparison of simulation results with experimental data for heat transfer coefficient at various effective lengths.
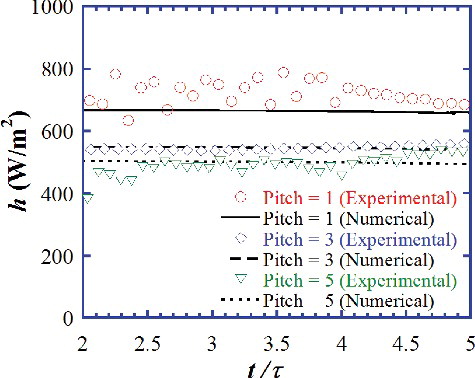
Figure 12. Distribution of heat transfer coefficient on the heater surface.
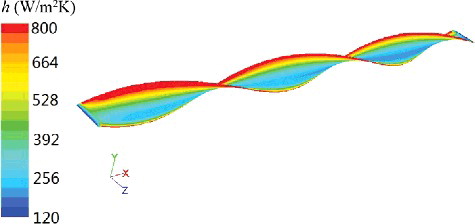
Figure 13. Cross section of temperature and velocity contours in YOZ plane.
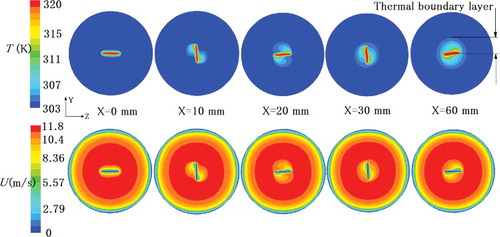
Figure 14. 3D velocity distribution around the twisted plate.
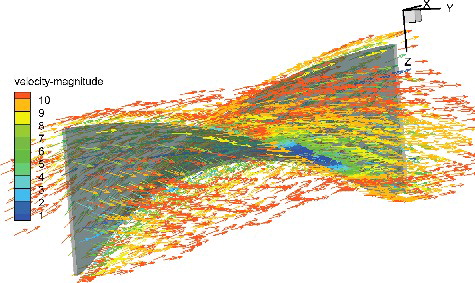
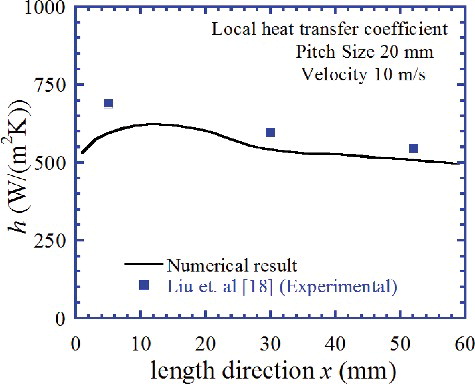
Figure 15. Local heat transfer coefficient along the twisted plate.