Figures & data
Figure 1. Computational liquidus projection of SiO2-B2O3-Na2O system at 300–2000 K.
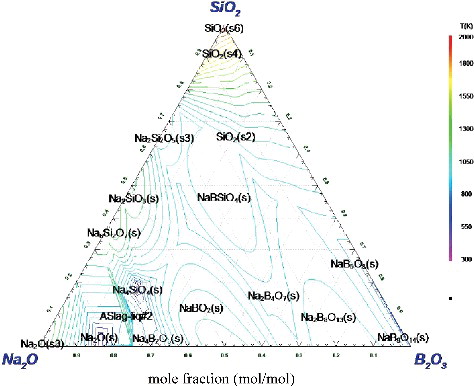
Figure 2. Computational phase diagram of SiO2-B2O3-Na2O ternary system in air at 1350 K. The grey area refers to the melting area at 1350 K and white circles are the composition ratio of SiO2-B2O3-Na2O for glass medium from various countries.
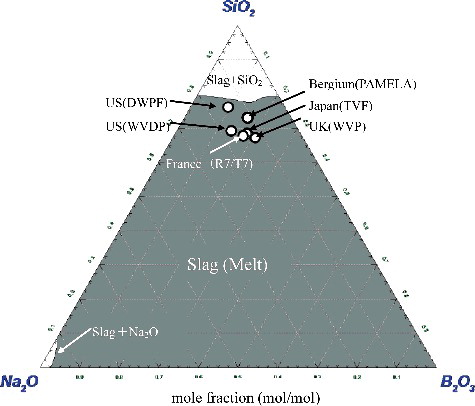
Figure 3. Computational phase diagram of Fe2O3-P2O5 system in air.
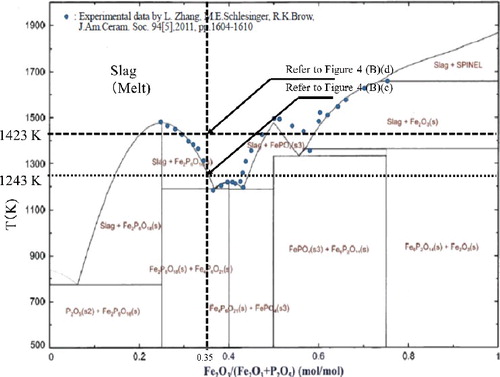
Figure 4. Schematic diagram of the hot-thermocouple cell used for observing the IPG forming process and experimental result.
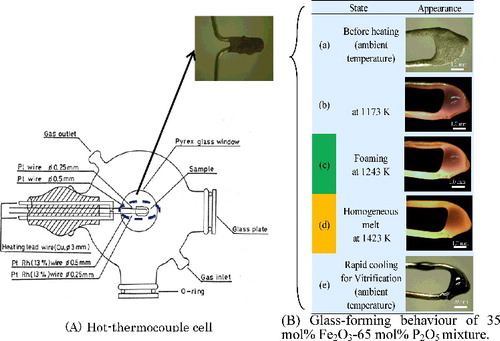
Figure 5. Computational phase diagrams of Fe2O3-P2O5 system at different partial pressures of oxygen. The grey area refers to the melting area.

Figure 6. Relative abundance of Fe2+as Fe2+/(Fe2++Fe3+) in the IPG.
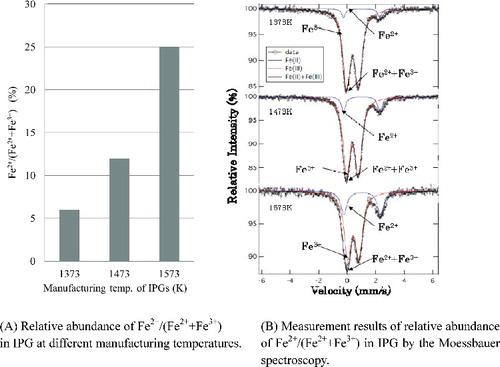
Figure 7. Computational phase diagram of FeO-Fe2O3-P2O5 system at 1500 K in 101 kPa. The grey area refers to the melting area.at1500 K.
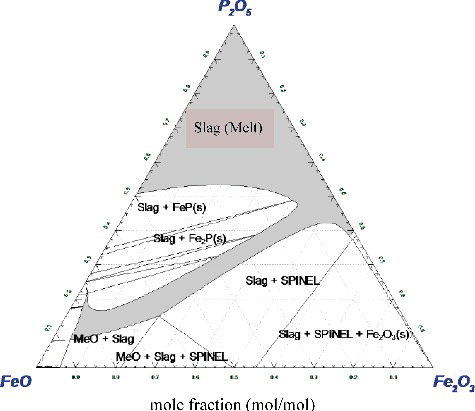
Figure 8. Phase diagrams of BaO-Fe2O3-P2O5 system for the comparison of experimental and calculated results.
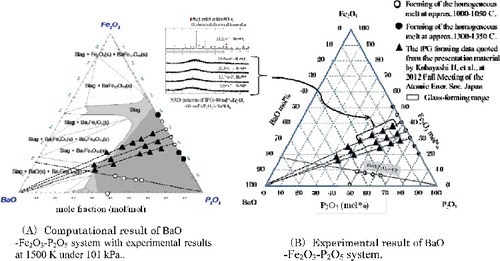
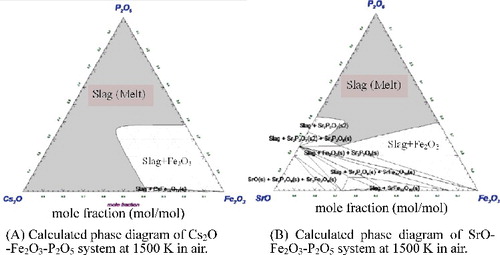
Figure 9. Calculated phase diagrams for the immobilization of radioactive substances in sludge at Fukushima Daiichi Nuclear Power Plant. The grey area refers to the melting area at 1500 K.