Figures & data
Table 1. Model parameters used.
Table 2. Main characteristics of ADS.
Table 3. Fuel composition at BOC.
Figure 1. Cross-sectional views of the PHITS calculation model.
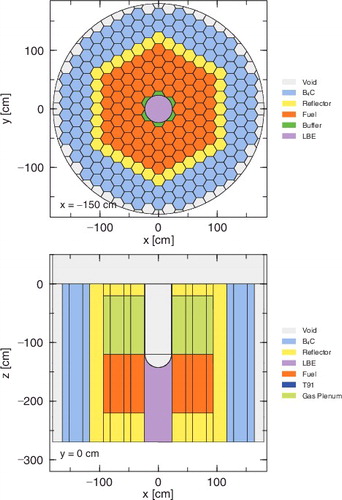
Table 4. Nuclear data libraries and calculation modules used.
Table 5. Peak values of parameters related to radiation damage and nuclear heat density per 1 mA at PBW at BOC. The symbols n and p denote contributions from neutrons and protons, respectively.
Figure 2. Neutron and proton energy spectra per 1 mA at PBW.
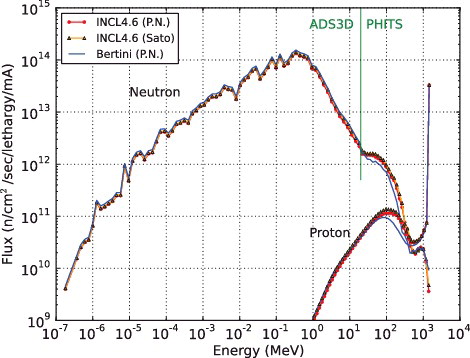
Figure 3. Total cross sections of 56Fe for an incident proton and neutron, and the relative difference from the Pearlstein–Niita systematics.
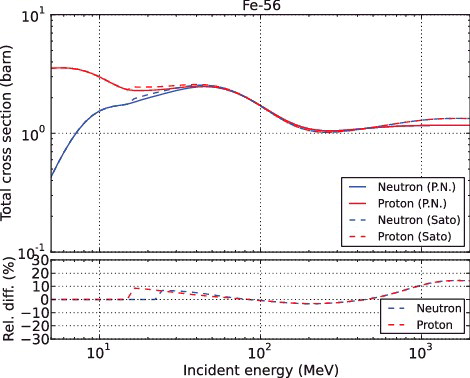
Figure 4. Helium and hydrogen gas production cross sections of T91 as a function of incident proton energy and the relative difference from INCL (P.N.).
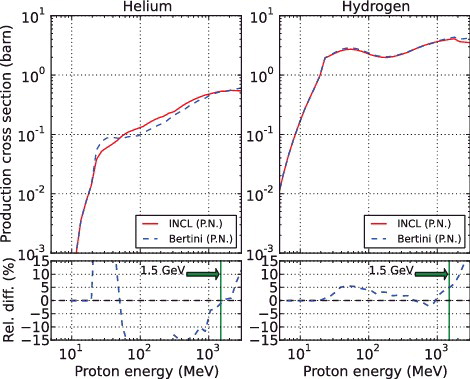
Figure 5. Charge distribution of spallation products in LBE target and relative difference from INCL (PN).
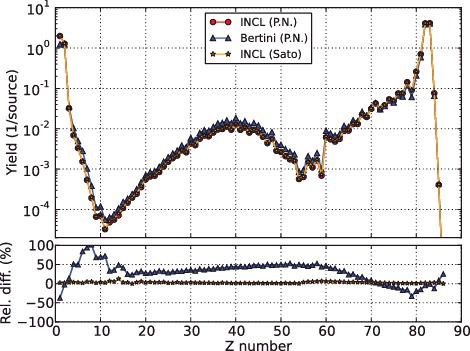
Figure 6. Average excitation energy for the p + 208Pb reaction transferred from the INC to the de-excitation model.
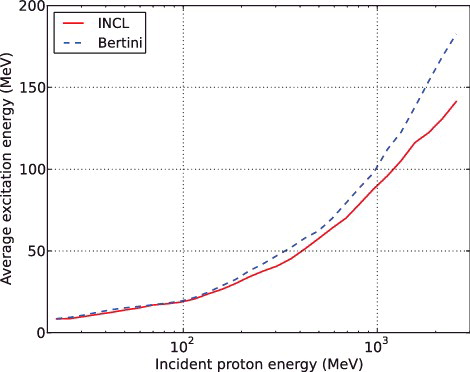
Table 6. Parameters in consideration of the initial burnup cycle, together with the number of cut-off neutrons.
Table 7. Cumulative peak parameter values related to the PBW radiation damage for the initial burnup cycle (600 EFPDs). The symbols n and p denote contributions from neutrons and protons, respectively.
Figure 7. Comparison of proton-induced non-elastic and neutron-induced total cross sections. Experimental data of the proton-induced non-elastic cross sections and the neutron-induced total cross sections are taken from [Citation26] and [Citation27–29], respectively.
![Figure 7. Comparison of proton-induced non-elastic and neutron-induced total cross sections. Experimental data of the proton-induced non-elastic cross sections and the neutron-induced total cross sections are taken from [Citation26] and [Citation27–29], respectively.](/cms/asset/cbd792bd-dc94-4e93-b965-3aba302f60b7/tnst_a_1140598_f0007_oc.jpg)
Figure 8. Energy distribution of cut-off neutrons.
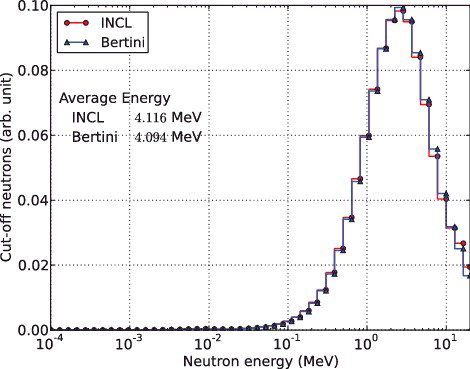
Figure 9. Comparison of spectral thick target neutron yields for 1.5-GeV protons on 20-cm-thick lead.
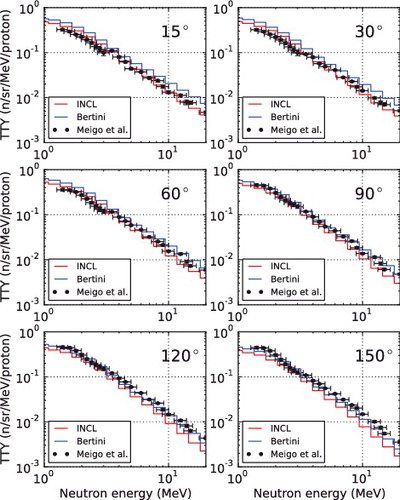
Figure 10. Comparison of spectral thick target neutron yields for 0.5-GeV protons on 20-cm-thick lead.
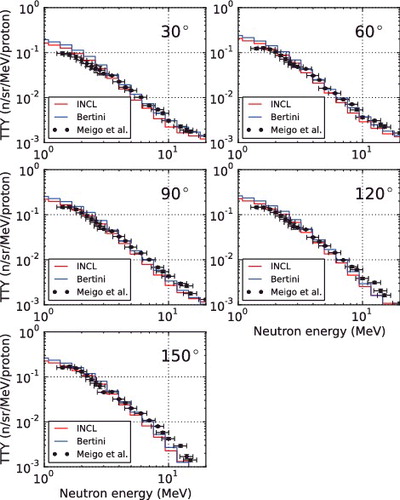
Figure 11. Comparison of the angular distribution of thick target neutron yields in the 2–20 MeV energy range for 20-cm-thick lead on 1.5- and 0.5-GeV protons.
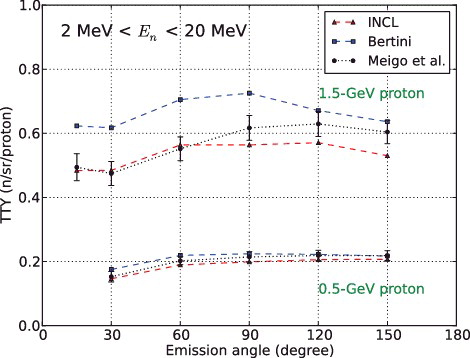
Figure 12. Activation cross sections of 115In(n, n′)115mIn and 27Al(n, 2n2p)24Na.
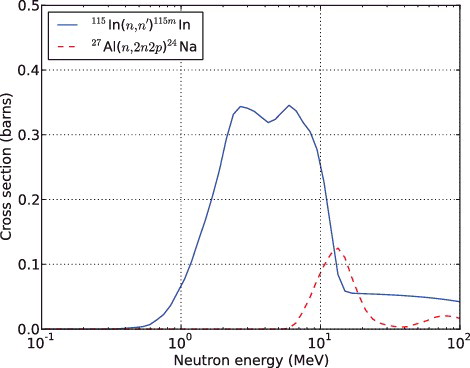
Figure 13. Comparison of 115In(n, n′)115mIn and 27Al(n, 2n2p)24Na reaction-rate distributions parallel to the axis of a mercury target.
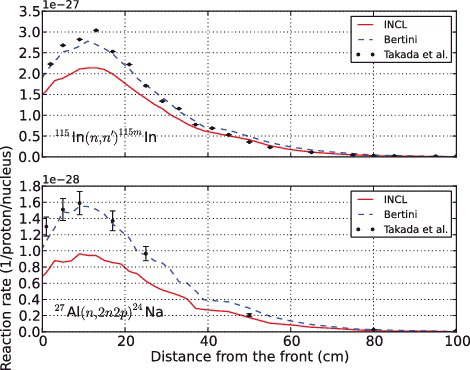
Figure 14. Schematic of the mercury target and detector positions (circles).
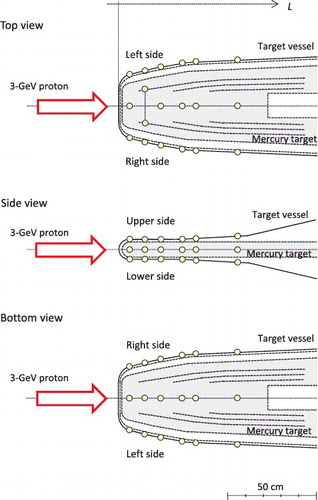
Figure 15. Comparison of 115In(n, n′)115mIn reaction-rate distributions on four surfaces of the target vessel.
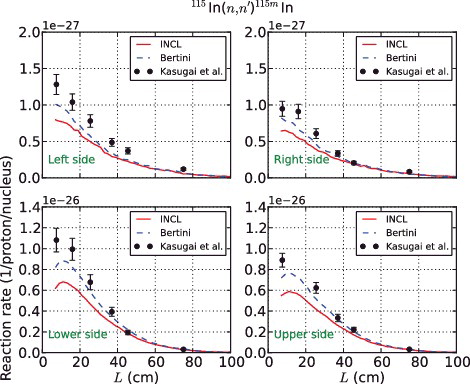
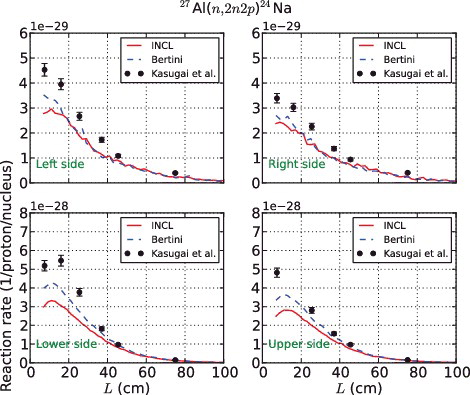
Figure 16. Comparison of 27Al(n, 2n2p)24Na reaction-rate distributions on four surfaces of the target vessel.