Figures & data
Figure 1. Evaluation methodology for SAM strategies.
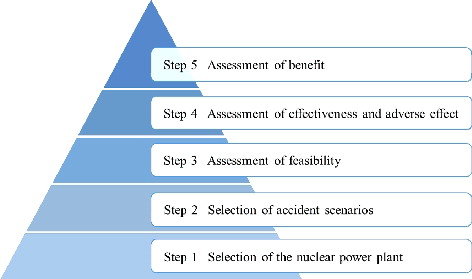
Table 1. Probability of transition from initiating events to severe accidents for OPR1000.
Figure 2. Flowchart of OPR1000 SAMG.
Table 2. Severe accident mitigation strategies of SAMG.
Table 3. Selection of mitigation measures.
Figure 3. MELCOR nodalization for OPR1000.
Figure 4. MELCOR nodalization for reactor core of OPR1000.
Table 4. OPR1000 operating conditions: design values per FSAR and steady-state MELCOR modeling results.
Table 5. Major accident sequences in the base cases.
Table 6. Major accident sequences for SBLOCA without SI in base and mitigation cases.
Table 7. Major accident sequences for SBO in base and mitigation cases.
Table 8. Major accident sequences for TLOFW in base and mitigation cases.
Figure 5. Core exit temperature in Mitigation-01 cases.
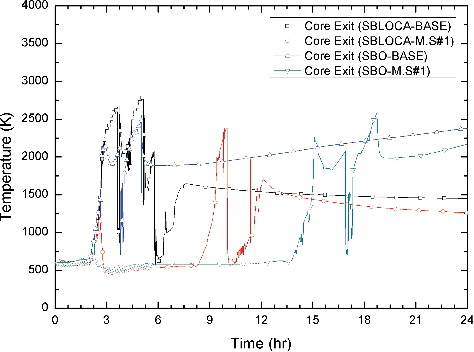
Figure 6. Containment pressure in Mitigation-02 cases.
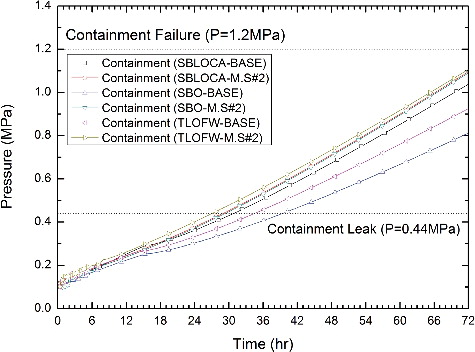
Figure 7. HPSI total flow rate in Mitigation-03 cases.
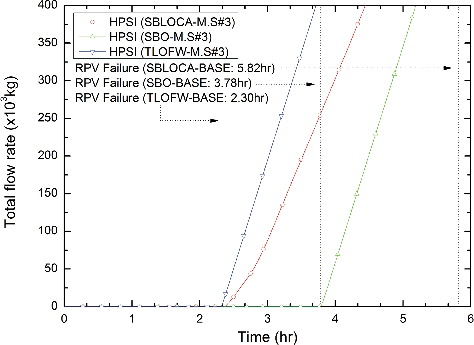
Figure 8. Cavity water level in Mitigation-04 cases.
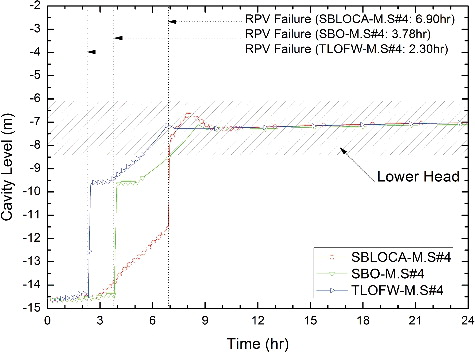
Figure 9. Mass of radioactive fission product in Mitigation-05 case (SBLOCA).
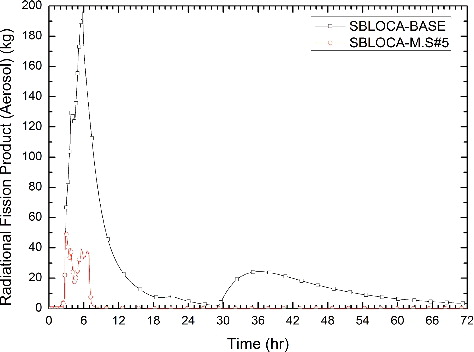
Figure 10. Mass of radioactive fission product in Mitigation-05 cases (SBO and TLOFW).
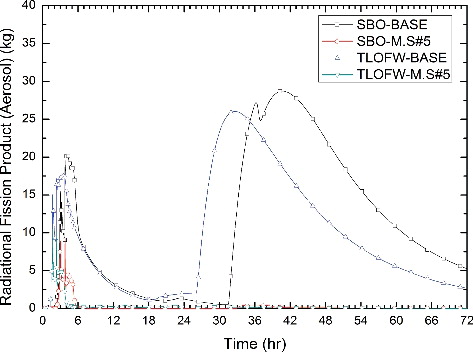
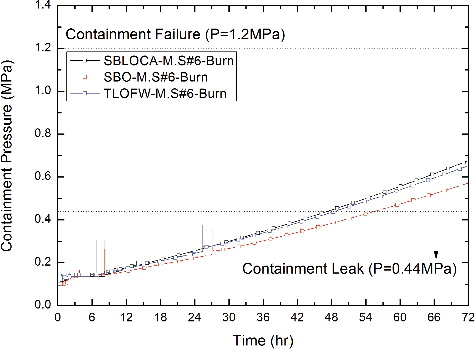
Figure 11. Containment pressure in Mitigation-06 cases.
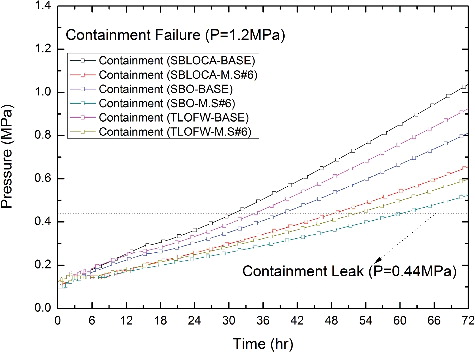
Figure 12. Hydrogen mole fraction in the containment in Mitigation-07 cases.
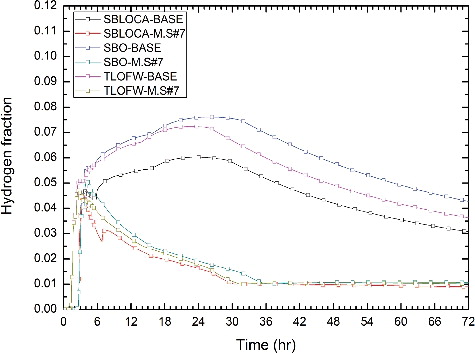
Figure 13. Shapiro diagram for SBLOCA without SI.

Figure 14. Shapiro diagram for SBO.
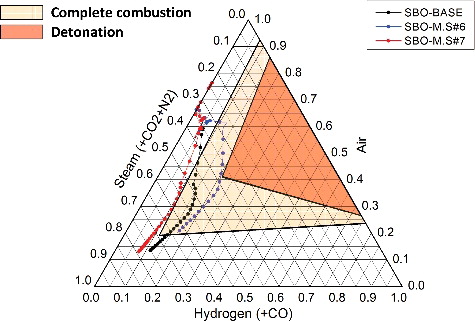
Figure 15. Shapiro diagram for TLOFW.
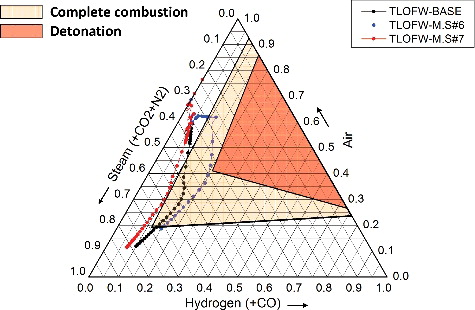
Figure 16. Containment pressure for Mitigation-06 cases, including hydrogen ignition.