Figures & data
Figure 1. Ship movement – the six degrees of freedom.
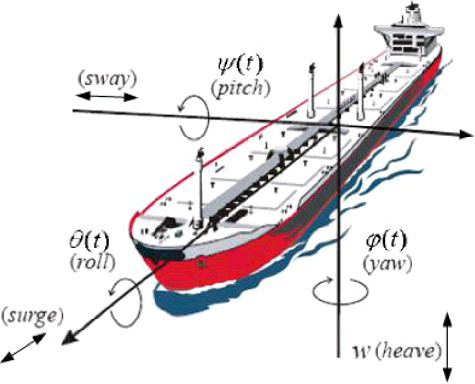
Figure 2. Geometry showing flow channel and noninertial frame.
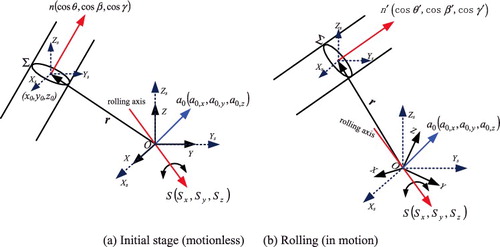
Figure 3. Schematic of staggered mesh.
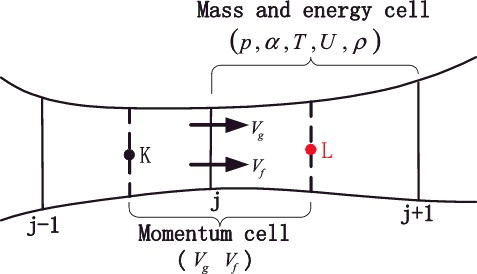
Figure 4. Algorithm to solve the two-phase flow equations.
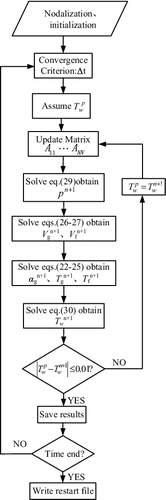
Figure 5. Schematic of the test facility.
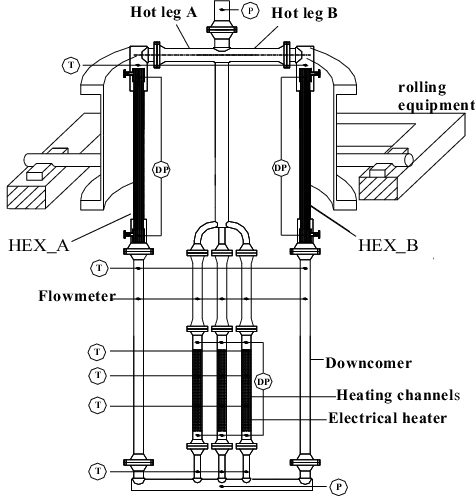
Figure 6. The result of natural circulation experiment under rolling condition.
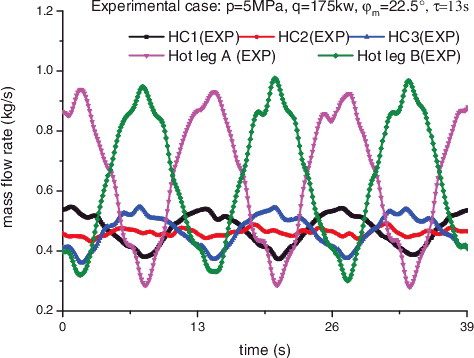
Figure 7. Nodalization of test facility for PNCMC.
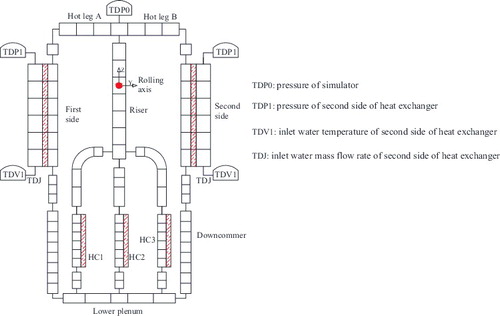
Figure 8. Comparison between experiment results and PNCMC prediction, experiment case: φm = 22.5°, τ = 13 s.
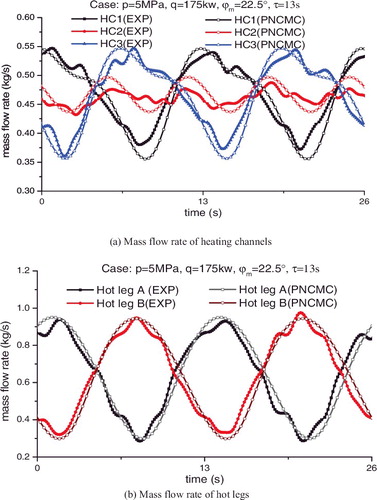
Figure 9 . Comparison between experiment results and PNCMC prediction, experiment case: .
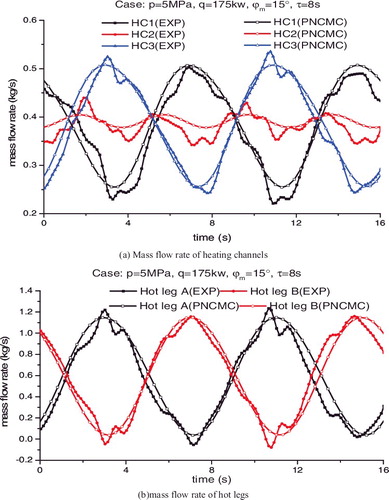
Figure 10. Schematic of test facility ( in Tan et al. [Citation7]).
![Figure 10. Schematic of test facility (Figure 2 in Tan et al. [Citation7]).](/cms/asset/37c746d0-397d-4045-9698-d233231750ec/tnst_a_1262295_f0010_oc.jpg)
Figure 11. The nodalization of Tan's test facility for PNCMC.
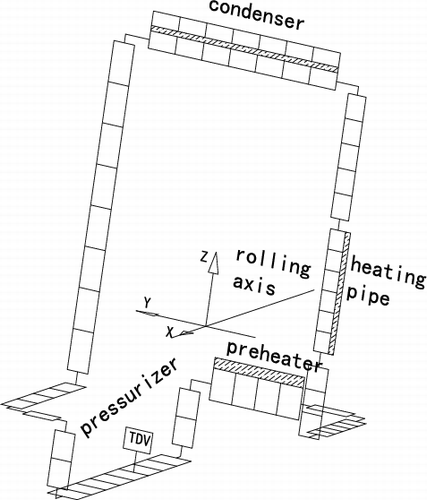
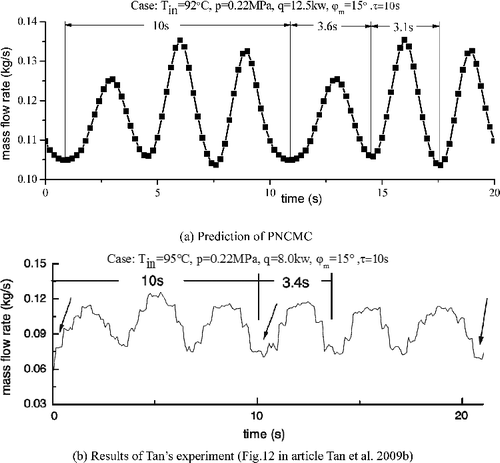
Figure 12. Mass flow rate variation under rolling motion.
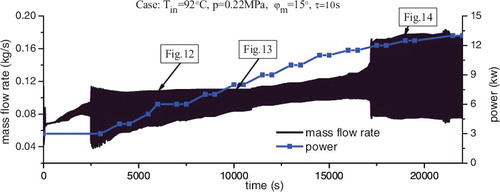
Figure 13. Mass flow rate variation at heating power equals to 6.0 kW.
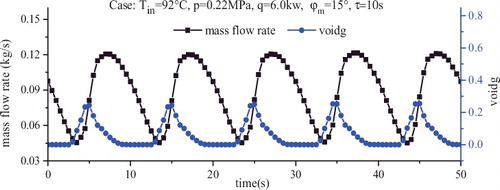
Figure 14. Irregular complex flow oscillation.
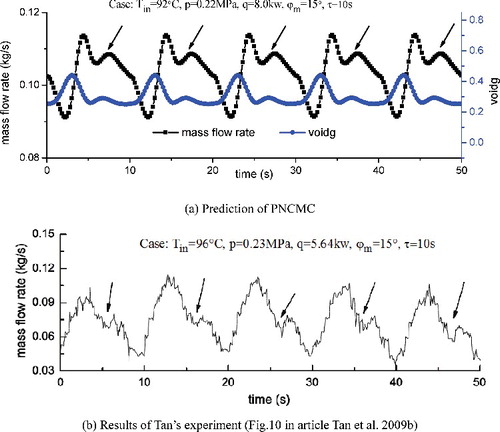
Figure 15. Overlapping of flow oscillation caused by rolling motion and density wave oscillation.