Figures & data
Table 1. Measurement data sets on UO2 and MOX fuels of light water reactors.
Table 2. Typical analytical methods applied in the isotopic compositions [Citation5].
Figure 1. Illustration of fuel assembly gaps between 17×17 fuel assemblies. The cells in the assemblies show the locations of fuel rods and guide tubes for control rods and instruments.
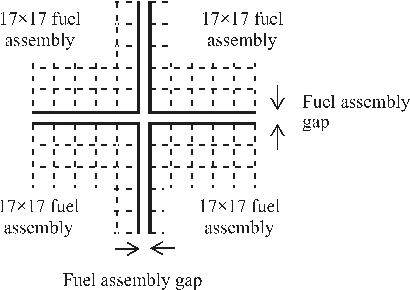
Figure 2. Locations of the fuel rods from which the fuel samples of the GU data set (GU1, GU2 and GU3 fuel samples) in the 15×15 fuel assemblies irradiated in Gösgen [Citation12]. ‘A’ shows the location of the fuel rod for GU1. ‘B’ shows the location of the fuel rod for GU2 and GU3 in the first and second cycles and ‘C’ that in the third cycle.
![Figure 2. Locations of the fuel rods from which the fuel samples of the GU data set (GU1, GU2 and GU3 fuel samples) in the 15×15 fuel assemblies irradiated in Gösgen [Citation12]. ‘A’ shows the location of the fuel rod for GU1. ‘B’ shows the location of the fuel rod for GU2 and GU3 in the first and second cycles and ‘C’ that in the third cycle.](/cms/asset/7981e5c1-f32f-4a0b-8de3-1fb82b9c2f25/tnst_a_1273802_f0002_oc.jpg)
Figure 3. Locations of the fuel rods from which the fuel samples of the Vandellos data set. ‘A,’ ‘B’ and ‘C’ shows the locations in the first four cycles and ‘D,’ ‘E’ and ‘F’ those in the fifth cycle [Citation13].
![Figure 3. Locations of the fuel rods from which the fuel samples of the Vandellos data set. ‘A,’ ‘B’ and ‘C’ shows the locations in the first four cycles and ‘D,’ ‘E’ and ‘F’ those in the fifth cycle [Citation13].](/cms/asset/222c530c-3154-453f-a444-633da56b3de1/tnst_a_1273802_f0003_oc.jpg)
Figure 4. Illustration of the assembly configuration in the multiple-assembly model.
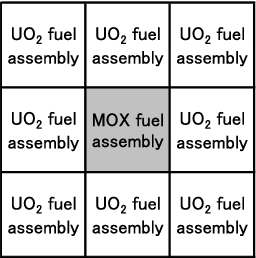
Table 3. Numbers of samples, averages and standard deviations (%) of C/E − 1's for actinide nuclides on the UO2 samples.
Table 4. Numbers of samples, averages and standard deviations (%) of C/E − 1's for fission product nuclides on UO2 samples.
Table 5. C/E − 1's and uncertainties (%) in C/E − 1's for the PWR GGM MOX sample, and averages and standard deviations (%) of C/E − 1's for the BWR GRM MOX samples on actinide nuclides for the single-assembly (Single A) and multiple-assembly models (Multi. A).
Table 6. C/E − 1's and uncertainties (%) in C/E − 1's for the PWR GGM MOX sample, and averages and standard deviations (%) of C/E − 1's for the BWR GRM MOX samples on fission product nuclides for the single-assembly (Single A) and multiple-assembly (Multi. A) models.
Figure 5. Effect of a gap between PWR fuel assemblies on C/E−1's of 235U for the data sets of Takahama-3 (PWR).
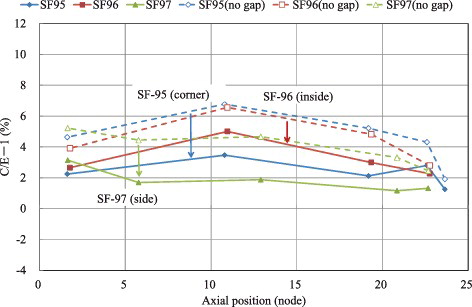
Figure 6. Effect of a gap between PWR fuel assemblies on C/E−1's of 239Pu for the data sets of Takahama-3 (PWR).
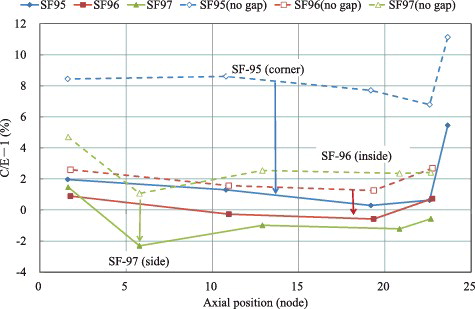
Figure 7. Effect of a gap between PWR fuel assemblies on C/E−1's of 148Nd for the data sets of Takahama-3 (PWR).
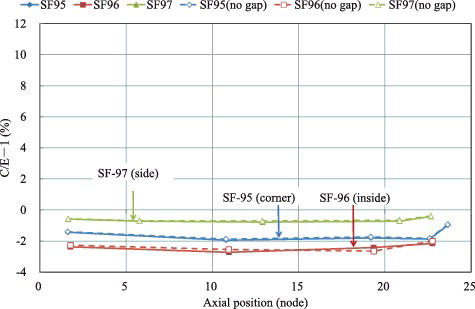
Figure 8. Radial positions of the fuel rods from which fuel samples were taken for the 9×9-9FP and 9×9-9Ac data sets of Fukushima-daini-1 (BWR) [Citation14].
![Figure 8. Radial positions of the fuel rods from which fuel samples were taken for the 9×9-9FP and 9×9-9Ac data sets of Fukushima-daini-1 (BWR) [Citation14].](/cms/asset/8bacfb74-395d-4fa5-8593-5d589a08b8c4/tnst_a_1273802_f0008_b.gif)
Figure 9. C/E − 1's of 235U vs. the axial positions of the fuel samples for the 9×9-9FP and 9×9-9Ac data sets of Fukushima-daini-1 (BWR).
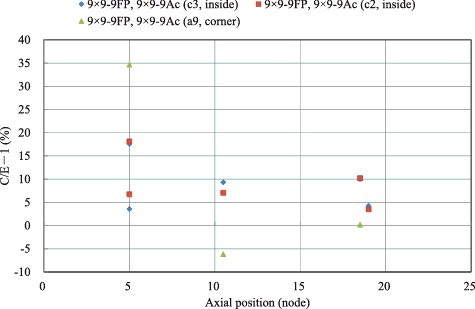
Figure 10. C/E − 1's of 239Pu vs. the axial positions of the fuel samples for the 9×9-9FP and 9×9-9Ac data sets of Fukushima-daini-1 (BWR).
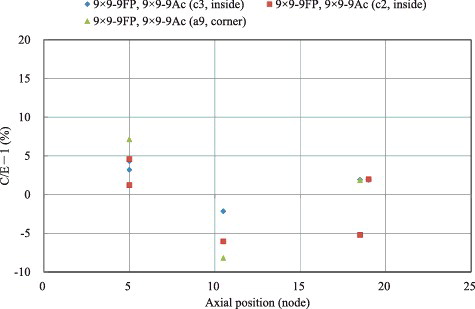
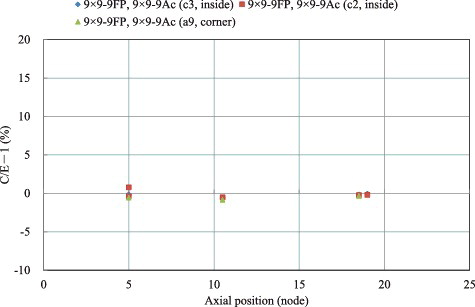
Figure 11. C/E − 1's of 148Nd vs. the axial positions of the fuel sampl es for the 9×9-9FP and 9×9-9Ac data sets.