368
Views
1
CrossRef citations to date
0
Altmetric
Article

Effect of metal ion location in reaction medium on formation process and structure of PtCu–CuO nanoparticles supported on carbon and γ-Fe2O3

, , , , , & show all
Pages 472-480 | Received 17 May 2016, Accepted 16 Dec 2016, Published online: 07 Mar 2017

Figures & data

Table 1. Average size and atomic ratios of PtCu nanoparticles measured using TEM, ICP-AES, and XRD. The sample IDs note the pH of the reaction medium and the support used.

Figure 1. Metal ion ratio in solution as a function of pH of precursor containing (a) carbon support and (b) γ-Fe2O3 support (circle denotes Pt ion and square denotes Cu ion).
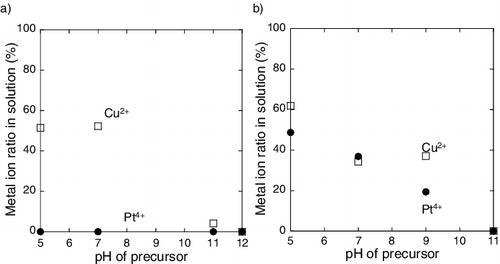
Figure 1. Metal ion ratio in solution as a function of pH of precursor containing (a) carbon support and (b) γ-Fe2O3 support (circle denotes Pt ion and square denotes Cu ion).

Figure 2. TEM micrographsaphs of PtCu nanoparticles supported on carbon at (a) pH 5, (b) pH 7, (c) pH 11, and (d) pH 12.
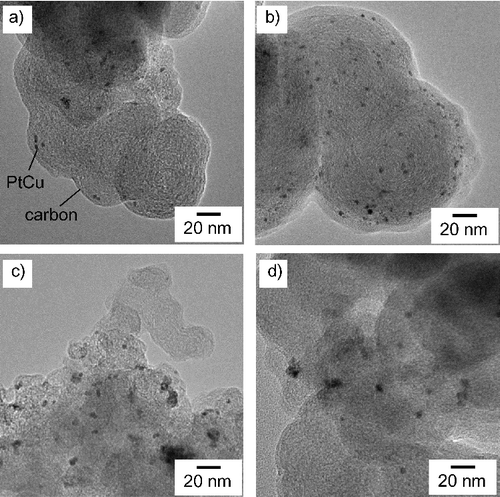
Figure 2. TEM micrographsaphs of PtCu nanoparticles supported on carbon at (a) pH 5, (b) pH 7, (c) pH 11, and (d) pH 12.

Figure 3. TEM micrographs of PtCu nanoparticles supported on γ-Fe2O3 at (a) pH 5, (b) pH 7, (c) pH 9, and (d) pH 11.
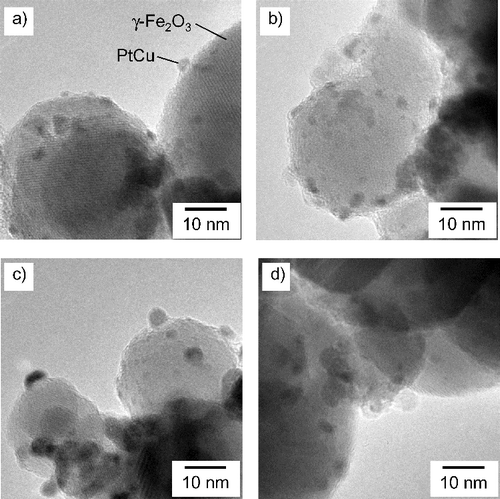
Figure 3. TEM micrographs of PtCu nanoparticles supported on γ-Fe2O3 at (a) pH 5, (b) pH 7, (c) pH 9, and (d) pH 11.

Figure 4. XRD patterns of PtCu nanoparticles supported on (a) carbon and (b) γ-Fe2O3.

Figure 4. XRD patterns of PtCu nanoparticles supported on (a) carbon and (b) γ-Fe2O3.

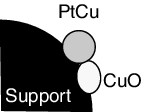
Figure 5. Schematic of supported PtCu nanoparticle.

Figure 5. Schematic of supported PtCu nanoparticle.

Table 2. Composition of PtCu nanoparticles determined from results (wt.%).

Figure 6. Cu composition in PtCu alloy particle as a function of metal ion content in solution for (a) carbon and (b) γ-Fe2O3 supports (circle denotes Pt ion and square denotes Cu ion).
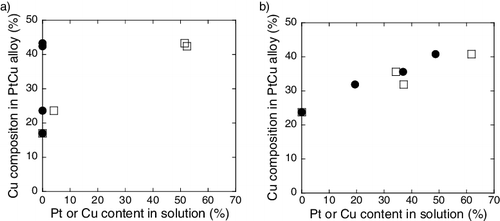
Figure 6. Cu composition in PtCu alloy particle as a function of metal ion content in solution for (a) carbon and (b) γ-Fe2O3 supports (circle denotes Pt ion and square denotes Cu ion).

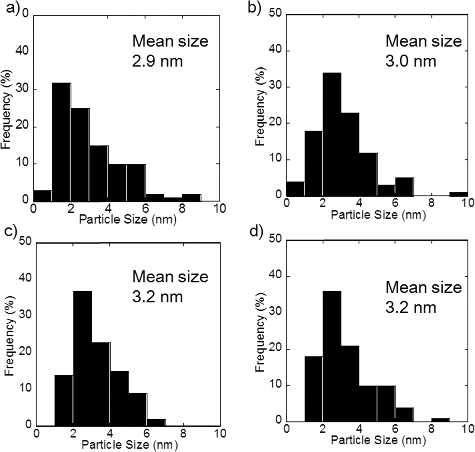
Figure A1. Particle size distribution of PtCu nanoparticles supported on carbon at (a) pH 5, (b) pH 7, (c) pH 11, and (d) pH 12.
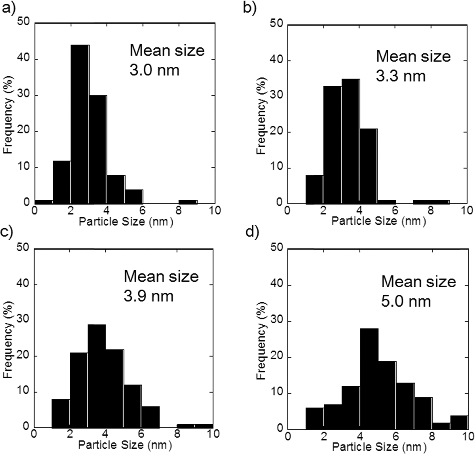
Figure A1. Particle size distribution of PtCu nanoparticles supported on carbon at (a) pH 5, (b) pH 7, (c) pH 11, and (d) pH 12.

Table B1. Chemical states of Pt and Cu calculated from linear combination fit of XANES spectra.

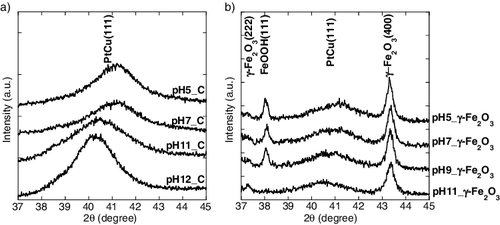
Figure A2. Particle size distribution of PtCu nanoparticles supported on γ-Fe2O3 at (a) pH 5, (b) pH 7, (c) pH 9, and (d) pH 11.

Figure A2. Particle size distribution of PtCu nanoparticles supported on γ-Fe2O3 at (a) pH 5, (b) pH 7, (c) pH 9, and (d) pH 11.

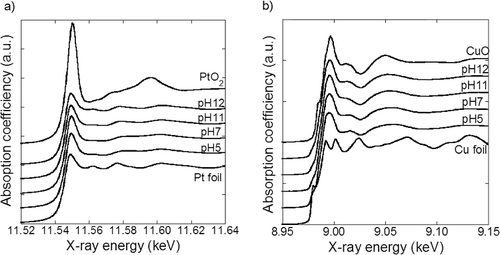
Figure B1. XANES spectra of PtCu nanoparticles supported on carbon (a) Pt–LIII and (b) Cu–K edges.

Figure B1. XANES spectra of PtCu nanoparticles supported on carbon (a) Pt–LIII and (b) Cu–K edges.

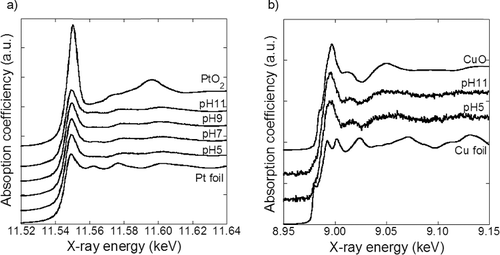
Figure B2. XANES spectra of PtCu nanoparticles supported on γ-Fe2O3 (a) Pt–LIII and (b) Cu–K edges.

Figure B2. XANES spectra of PtCu nanoparticles supported on γ-Fe2O3 (a) Pt–LIII and (b) Cu–K edges.

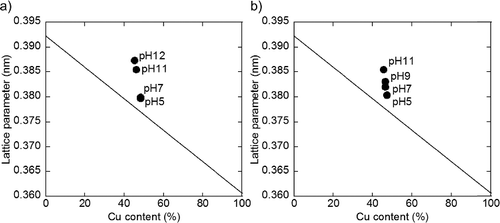
Figure C. Plot of lattice parameter as a function of Cu content in nanoparticles for (a) carbon and (b) γ-Fe2O3 supports.

Figure C. Plot of lattice parameter as a function of Cu content in nanoparticles for (a) carbon and (b) γ-Fe2O3 supports.

Reprints and Corporate Permissions

Please note: Selecting permissions does not provide access to the full text of the article, please see our help page How do I view content?

To request a reprint or corporate permissions for this article, please click on the relevant link below:

Academic Permissions

Please note: Selecting permissions does not provide access to the full text of the article, please see our help page How do I view content?

Obtain permissions instantly via Rightslink by clicking on the button below:

If you are unable to obtain permissions via Rightslink, please complete and submit this Permissions form. For more information, please visit our Permissions help page.