Figures & data
Figure 1. Experimental apparatus.
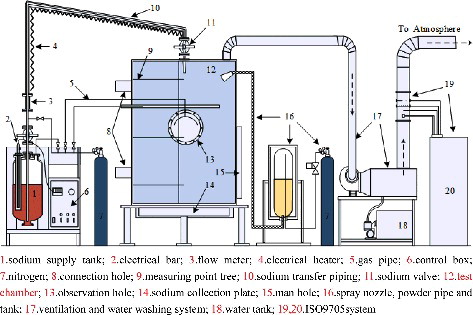
Figure 2. Distributions of measuring points in the chamber space and sodium collection plate (units: mm).
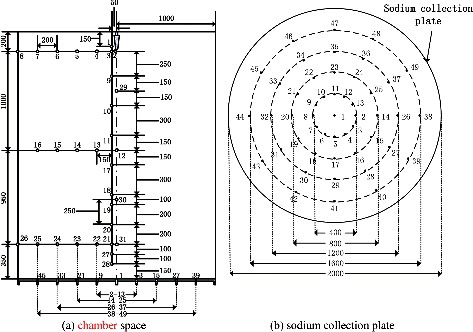
Figure 3. Temperature distributions at different heights in the longitudinal central line.
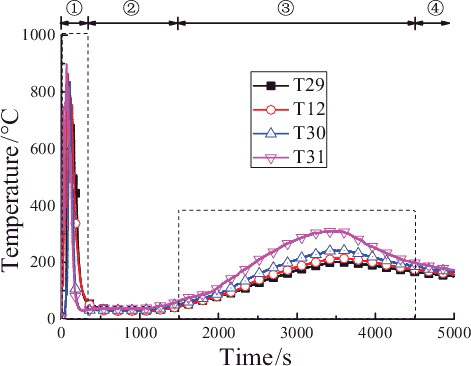
Figure 4. Temperature distributions at different heights of chamber in the longitudinal central line in phase ![]()
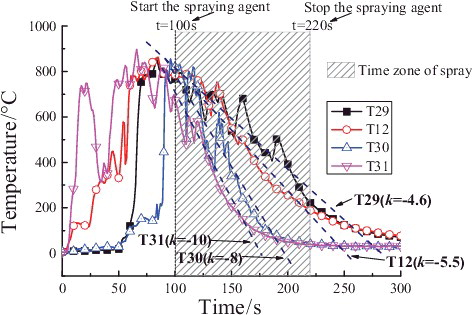
Figure 5. Temperature distributions of longitudinal heights measuring points in the chamber space.
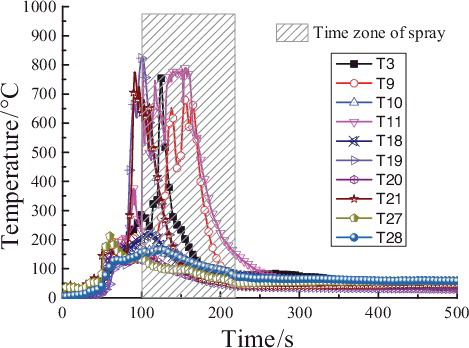
Figure 6. Temperature distributions at longitudinal heights (direction: T1–T28) in the chamber space.
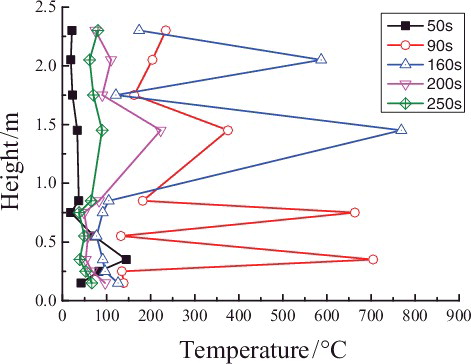
Figure 7. TMax and corresponding tMax T at different longitudinal heights (direction: T1–T28) in the chamber space.
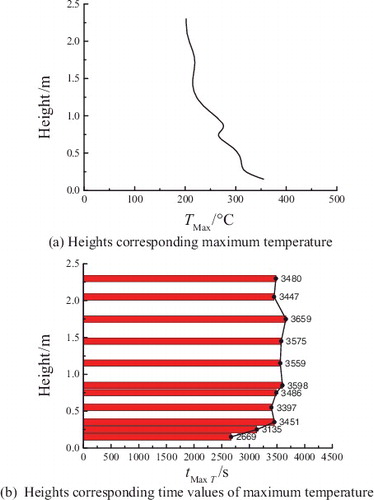
Figure 8. Temperature distributions of radial measuring points T21, T23, T25, and T26 in the chamber space.
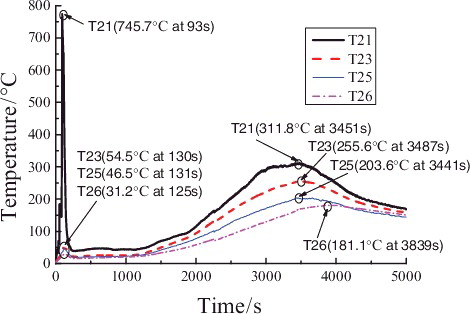
Figure 9. Temperature distributions of radial measuring points T13, T14, T15, and T16 in the chamber space.
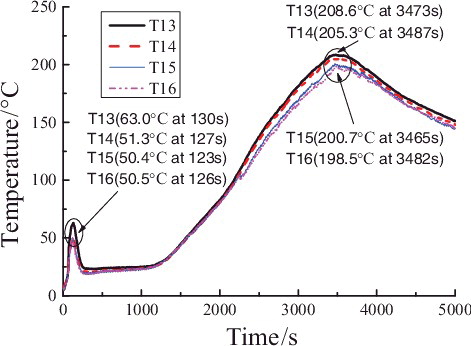
Figure 10. Dynamic temperature field in the sodium collection plate (unit: °C).
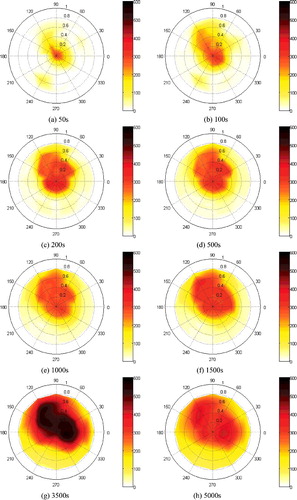
Figure 11. Temperature distributions of radial measuring points (direction: Td1–Td45) in the sodium collection plate.
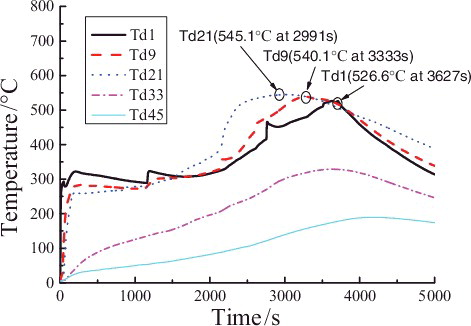
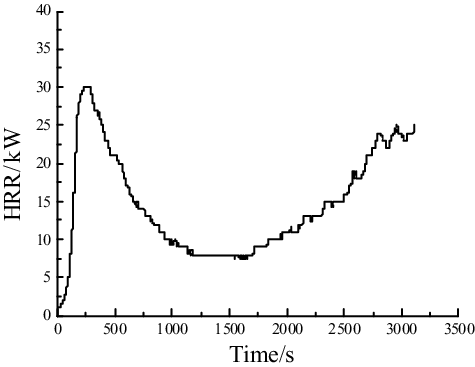
Figure 12. Heat release rate of sodium fire in a columnar flow under suppression by extinguishing agent.