
Figures & data
Figure 1. Flowchart of the dose assessment procedure.
Table 1. Input parameters.
Figure 2. Bottom topography for (a) ROMS for around Japan and (b) POP for the global ocean.
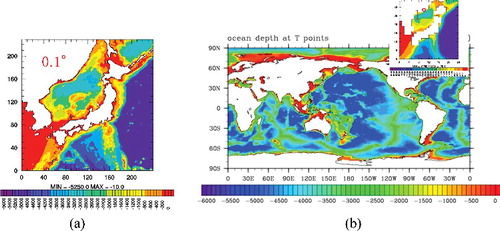
Table 2. Conditions and parameters for estimation of the dose equivalent.
Table 3. Results of release rate estimations from a CSD-C canister.
Table 4. Results of release rate estimations from a CSD-B canister.
Figure 3. Ocean current distributions in the surface layer. Vectors show the current speed and direction. Color scale also shows the current speed. (a) ROMS around Japan. For clarity, vectors are only shown over a 1/2° grid. (b) POP for the global ocean. For clarity, vectors are only shown over a 5° grid.
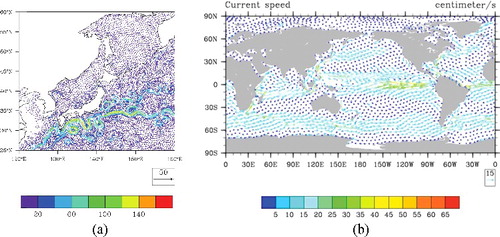
Figure 4. Monthly averaged surface distributions of tracer concentration (unit m−3) by ROMS at 1 unit year−1 release. The X shows the release point and the triangle shows the point of maximum concentration.
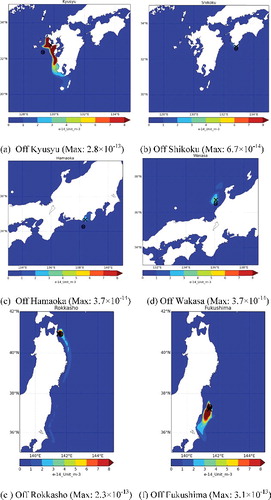
Table 5. Release depths, release points, maximum tracer concentrations, and their points for the near shore cases
Table 6. Estimated results of radionuclides concentration and dose equivalent for public at the submergence of a CSD-C canister near shore.
Table 7. Estimated results of radionuclides concentration and dose equivalent for public at the submergence of a CSD-B canister near shore.
Figure 5. Annual averaged surface distributions of tracer concentration (unit m−3) by POP at 1 unit year−1 release. The X shows the release point and the circle with cross shows the point of maximum concentration.
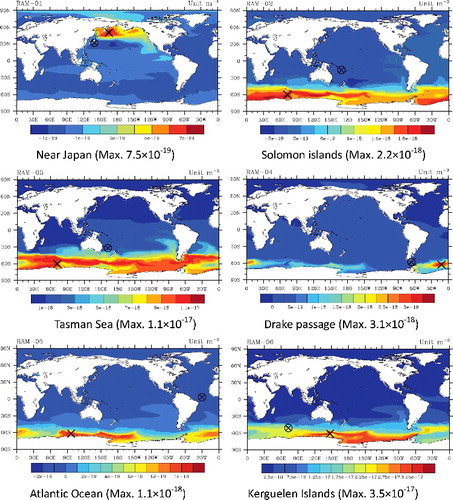
Table 8. Release depths, release points, maximum tracer concentrations, and their points for the deep sea cases
Table 9. Estimated radionuclide concentrations and dose equivalents from the submergence of a CSD-C canister in deep sea.
Table 10. Estimated radionuclide concentrations and dose equivalents from the submergence of a CSD-B canister in deep sea.
Table 11. Summary of the estimated dose equivalents from one package.