Figures & data
Figure 1. Volume changes by isochronal annealing for 6 h of the Al2O3 specimen irradiated to 2.0–2.5 × 1024 n/m2 (E > 0.1 MeV) at 60–90 °C.
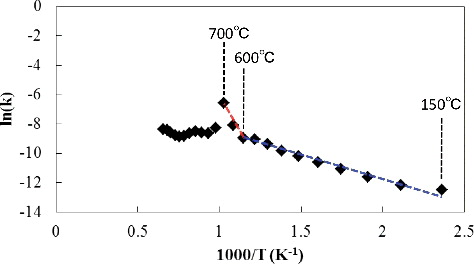
Figure 2. Arrhenius plot of the rate coefficients for the macroscopic volume recovery during isothermal annealing of the neutron-irradiated Al2O3 specimen.
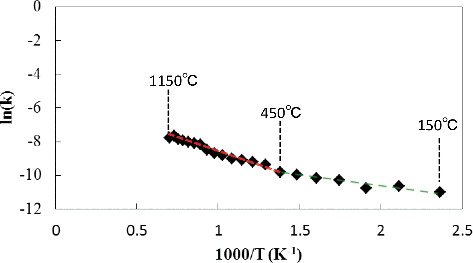
Figure 3. Volume changes by isochronal annealing for 6 h of the Y2O3 specimen irradiated to 2.0–2.5 × 1024 n/m2 (E > 0.1 MeV) at 60–90 °C.
Figure 4. Arrhenius plot of the rate coefficients for the macroscopic volume recovery during isothermal annealing of the neutron-irradiated Y2O3 specimen.
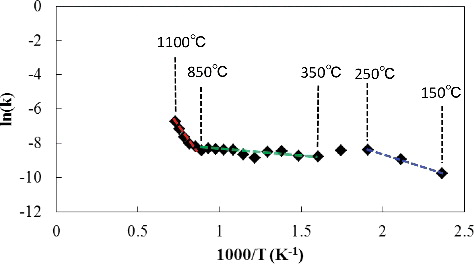
Figure 5. Volume changes by isochronal annealing for 6 h of the YAG specimen irradiated to 2.0–2.5 × 1024 n/m2 (E > 0.1MeV) at 60–90 °C.
Figure 6. Arrhenius plot of the rate coefficients for the macroscopic volume recovery during isothermal annealing of the neutron-irradiated YAG specimen.