Figures & data
Table 1. Sample profile (N = 952).
Figure 1. Goodness-of-fit according to number of classes. X-axes denote the number of pre-assumed latent classes.
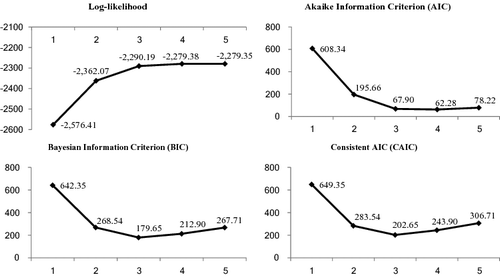
Table 2. AIC and BIC analyses for the three- and four-class solutions.
Table 3. Nuclear power acceptance according to latent classes.
Table 4. Determinants of cluster membership: multinomial probit.
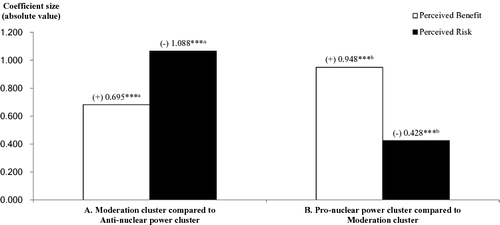
Figure 2. Relative coefficient sizes of perceived benefit and risk. ***p < 0.01. (+) A positive effect on the membership to the cluster with the greater level of nuclear power acceptance; (−) a negative effect on such membership. The perceived benefit and the perceived risk variables have been standardized. aCoefficient sizes are different at the 0.10 level (p = 0.062); bdifferent at the 0.01 level (p = 0.006).