
Figures & data
Figure 1. Schematic top view of VIN ROSE beam line at BL06 at J-PARC/MLF. The neutron guide parts are described in red double lines. There are straight guides in the shutter and biological shields. The two and three guide parts are installed for MIEZE and NRSE, respectively.
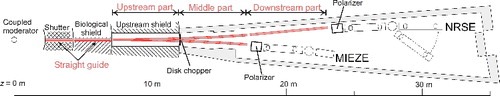
Table 1. Design parameters of neutron guides for the MIEZE and NRSE at J-PARC/MLF.
Figure 2. PHITS geometry with (a) horizontal (xz)-plane at y = 0 and (b) vertical (yz)-plane at x = 0 in the BL06 shielding design. The total (neutron and photon) dose rate maps, (c) horizontal (xz)-plane at y = 0 and (d) vertical (yz)-plane at x = 0, were calculated on the PHITS geometry.
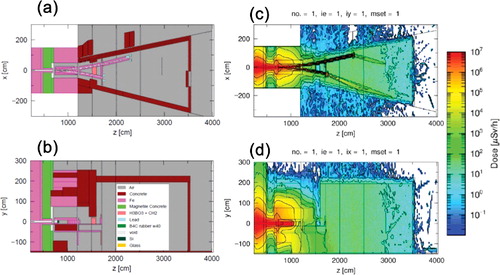
Figure 3. Calculated neutron spectra of wide energy range at the source, the guide exit of the MIEZE (z = 17.1 m) and NRSE (z = 22.7 m), respectively. (b) Calculated neutron spectra of slow energy range at the guide exit of the MIEZE (z = 17.1 m) and NRSE (z = 22.7 m) as a function of wavelength with narrow energy range.
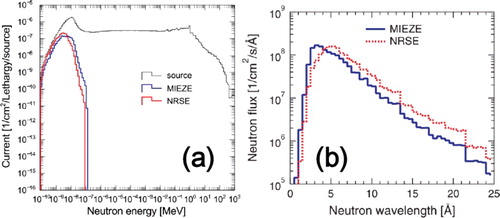
Figure 4. PHITS parameter α of measured NiC/Ti supermirror for the MIEZE and NRSE as a function of the m value.
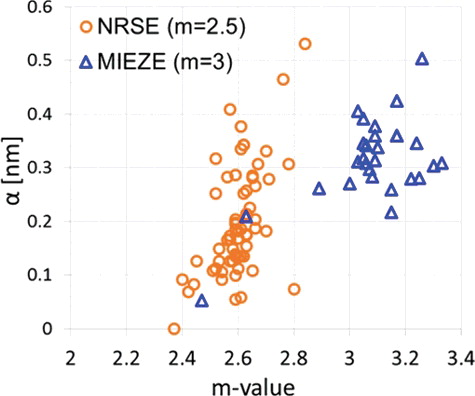
Figure 5. Schematic experimental setup of TOF spectrum and absolute neutron flux measurement for the performance evaluation of the VIN ROSE guide system. Detectors were located at the vicinities of the guide exits of the MIEZE (z = 17.3 m) and NRSE (z = 22.9 m) guides, respectively.
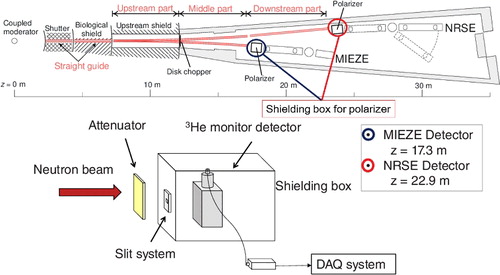
Figure 6. Neutron spectrum of total cross section at the vicinities of the guide exits of the (a) MIEZE (z = 17.3 m) and (b) NRSE (z = 22.9 m). The blue bronken and red solid lines are calculated and measured, respectively. The light red solid lines from (a) 12.5 Å and (b) 9.5 Å were extrapolated with a power function of neutron wavelength.
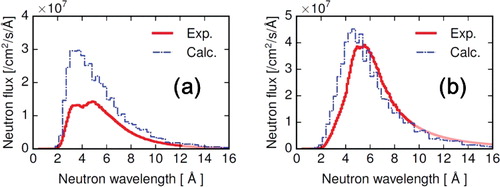
Table 2. Performance parameters of the neutron guide system for VIN ROSE at the BL06 at the J-PARC/MLF.
Figure 7. Total neutron intensity maps and TOF spectra as a position-dependence at the vicinity of the MIEZE guide exit (z = 17.3 m) at 0.275 MW operation. The TOF spectra were measured at three positions: (a) zigzag (x = −5, y = 0 [mm]), (b) center (x = 0, y = 0 [mm]) and (c) garland (x = +5, y = 0 [mm]) sides at the measured map. The detection area of the TOF measurement was 5 mm × 10 mm.
![Figure 7. Total neutron intensity maps and TOF spectra as a position-dependence at the vicinity of the MIEZE guide exit (z = 17.3 m) at 0.275 MW operation. The TOF spectra were measured at three positions: (a) zigzag (x = −5, y = 0 [mm]), (b) center (x = 0, y = 0 [mm]) and (c) garland (x = +5, y = 0 [mm]) sides at the measured map. The detection area of the TOF measurement was 5 mm × 10 mm.](/cms/asset/2f6930fb-e951-4a28-9329-22ecf51422f4/tnst_a_1359699_f0007_oc.jpg)
Figure 8. TOF spectra at the vicinity of the MIEZE guide exit (z = 17.3 m) were measured at three positions: (a) zigzag (x = −5, y = 0 [mm]), (b) center (x = 0, y = 0 [mm]) and (c) garland (x = +5, y = 0 [mm]) sides at the measured map as shown in . The neutron fluxes calculated at the (a), (b) and (c) positions were multiplied by 0.65, 0.65 and 0.5, respectively.
![Figure 8. TOF spectra at the vicinity of the MIEZE guide exit (z = 17.3 m) were measured at three positions: (a) zigzag (x = −5, y = 0 [mm]), (b) center (x = 0, y = 0 [mm]) and (c) garland (x = +5, y = 0 [mm]) sides at the measured map as shown in Figure 7. The neutron fluxes calculated at the (a), (b) and (c) positions were multiplied by 0.65, 0.65 and 0.5, respectively.](/cms/asset/1bb05141-635d-4b0c-a3b3-be48363a1c9b/tnst_a_1359699_f0008_oc.jpg)
Figure 9. Total neutron intensity maps and TOF spectra as a position-dependence at the vicinity of the NRSE guide exit (z = 22.9 m) at 0.275 MW operation. The TOF spectra were measured at three positions: (a) garland (x = −10, y = 0 [mm]), (b) center (x = 0, y = 0 [mm]) and (c) zigzag (x = +10, y = 0 [mm]) sides at the measured map. The detection area of the TOF measurement was 5 mm × 10 mm.
![Figure 9. Total neutron intensity maps and TOF spectra as a position-dependence at the vicinity of the NRSE guide exit (z = 22.9 m) at 0.275 MW operation. The TOF spectra were measured at three positions: (a) garland (x = −10, y = 0 [mm]), (b) center (x = 0, y = 0 [mm]) and (c) zigzag (x = +10, y = 0 [mm]) sides at the measured map. The detection area of the TOF measurement was 5 mm × 10 mm.](/cms/asset/ef44c1dc-47ad-41b0-9dde-857acdcca8d3/tnst_a_1359699_f0009_oc.jpg)