Figures & data
Table 1. Chemical composition of the as-received Zr–Sn–Nb alloy
Figure 1. The microstructure of the Zr–Sn–Nb alloy.
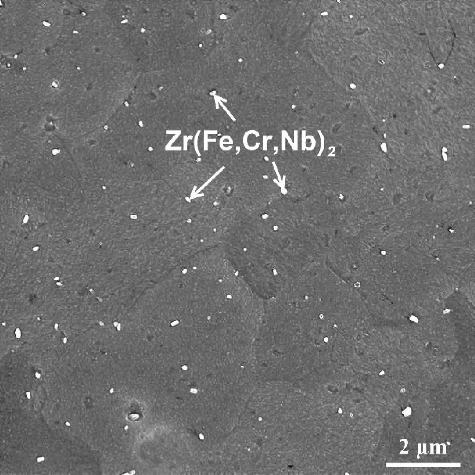
Figure 2. The photograph of (a) the ring specimen with gauge section and (b) the assembling type of the ring specimen for the I-SCC experiment.
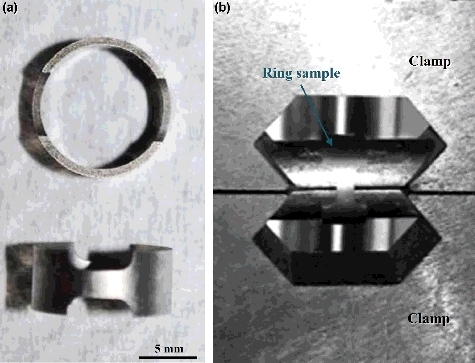
Figure 3. The testing equipment for I-SCC experiments under the ring tensile condition. (a) Schematic diagram; (b) photograph of the testing equipment.
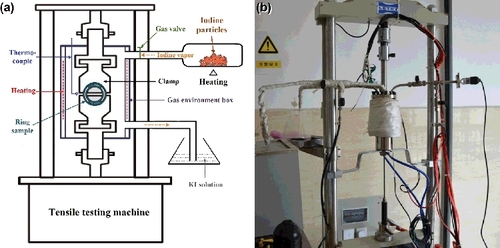
Figure 4. Load-displacement curves of the I-SCC experiments under different partial pressures of iodine vapor.
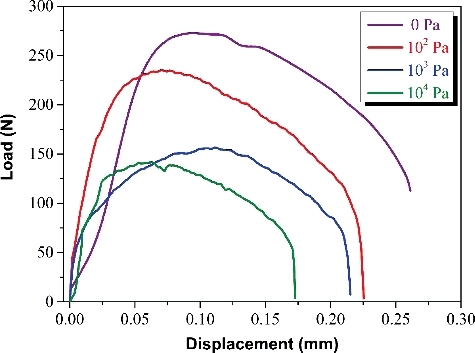
Figure 5. The microstructure and EDS analysis of the specimen surface after I-SCC experiment with iodine pressure of 102 Pa.
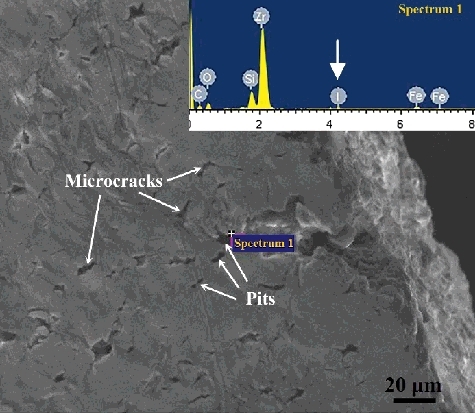
Figure 6. The maximum tensile strength and fracture energy of Zr–Sn–Nb specimens as function of the partial pressure of iodine vapor.
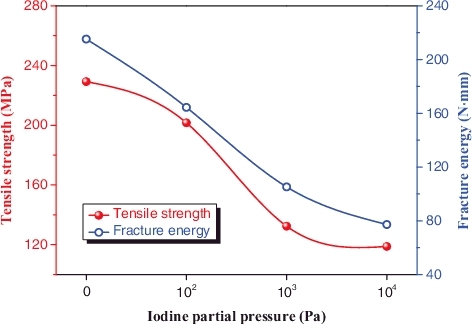
Figure 7. The low magnification fracture morphologies of Zr–Sn–Nb specimens at different partial pressures of iodine. (a) Without iodine; (b) 102 Pa; (c) 103 Pa; (d) 104 Pa.
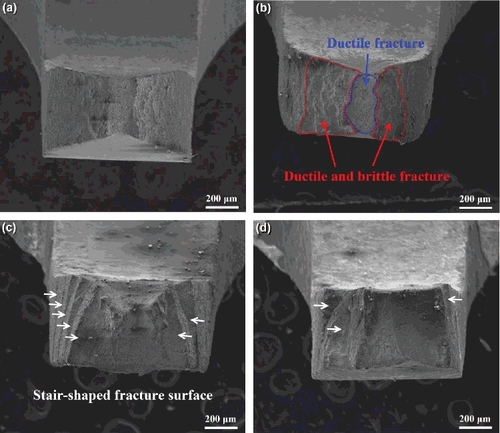
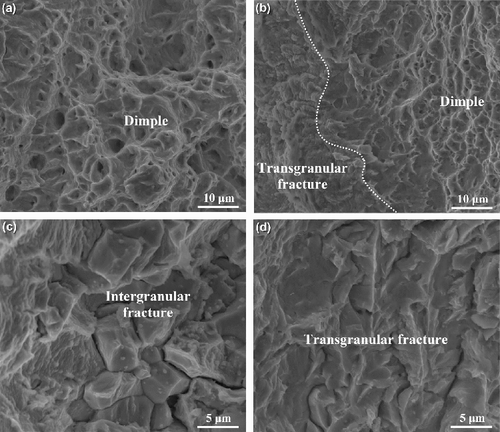
Figure 8. The high magnification fracture morphologies of Zr–Sn–Nb specimens at different partial pressures of iodine. (a) Without iodine; (b) 102 Pa; (c) 103 Pa; (d) 104 Pa.