Figures & data
Figure 1. Framework of integrating the simulation and knowledge-based information processing.
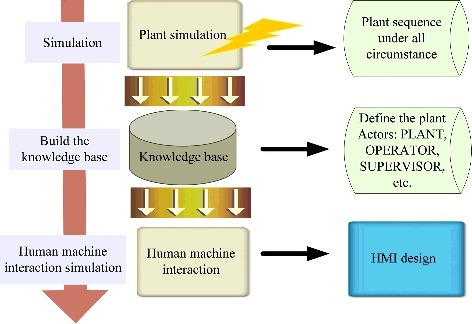
Figure 2. Basic scheme of designing and evaluation of human–machine interface.
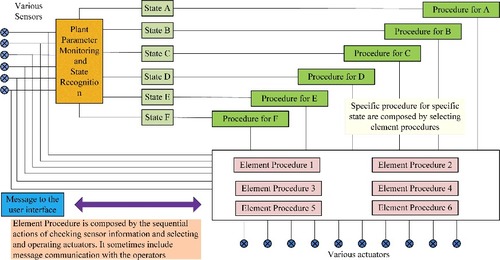
Figure 3. The hierarchical representation of the plant configuration including both the plant and human.
Figure 4. The connection between the plant DiD risk monitor system and the plant simulation system.
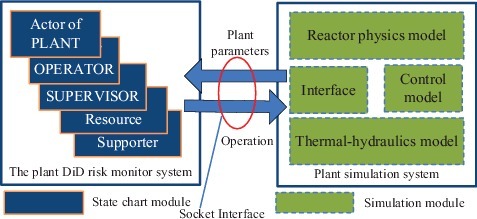
Figure 5. Configuration of passive safety system of AP1000 assumed in this study [Citation21,Citation22].
![Figure 5. Configuration of passive safety system of AP1000 assumed in this study [Citation21,Citation22].](/cms/asset/b6a0509a-0106-4000-9926-03052c039648/tnst_a_1417171_f0005_oc.jpg)
Table 1. Simulation results of the different scenarios
Figure 6. System pressure in case of SBLOCA (scenario 1 [Citation24] and scenario 2 [Citation23]).
![Figure 6. System pressure in case of SBLOCA (scenario 1 [Citation24] and scenario 2 [Citation23]).](/cms/asset/1a6a24fb-2964-43eb-9d5e-6ee5c411fd74/tnst_a_1417171_f0006_oc.jpg)
Figure 7. Activation sequence of safety system in case of SBLOCA (scenario 1) [Citation22]..
![Figure 7. Activation sequence of safety system in case of SBLOCA (scenario 1) [Citation22]..](/cms/asset/d4e110f1-1e4d-4e27-a369-2851070c2df6/tnst_a_1417171_f0007_oc.jpg)
Table 2. Sensor models for the different signals
Figure 8. The top and hierarchical diagram for the passive safety systems.
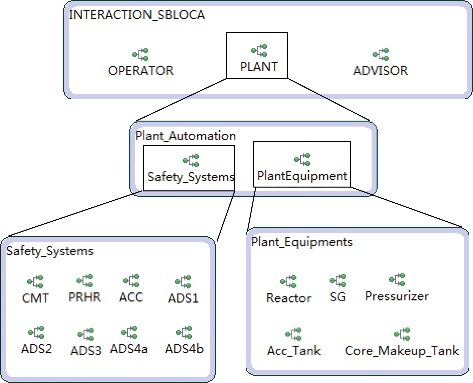
Figure 9. The process of the shift technical advisor.
Figure 10. The detailed model for the ADVISOR actor.
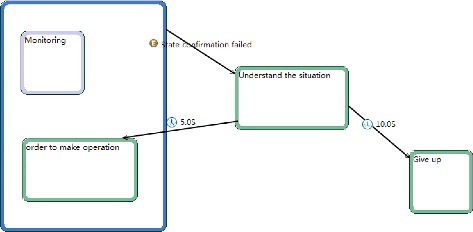
Figure 11. The process of the OPERATOR.
Figure 12. The detailed model for the OPERATOR actor.
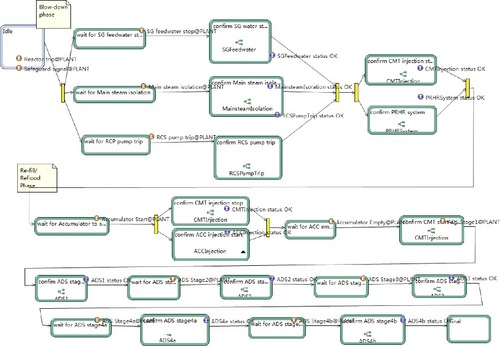
Figure 13. The process of the automation.
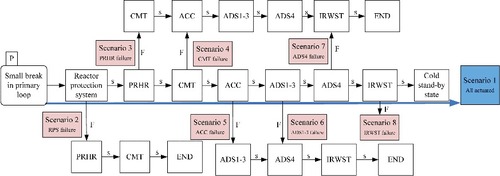
Figure 14. The detailed model for automation in PLANT actor.
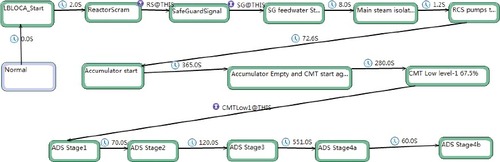
Figure 15. Display of human–machine interaction by plant DiD risk monitor.
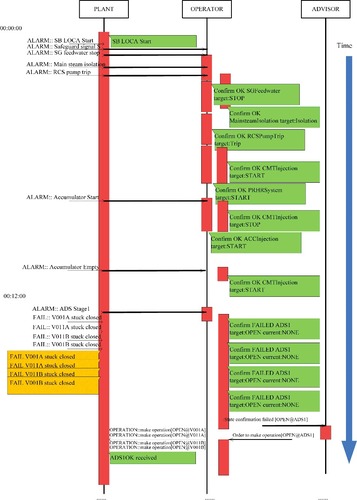
Figure 16. Safety system status example display.
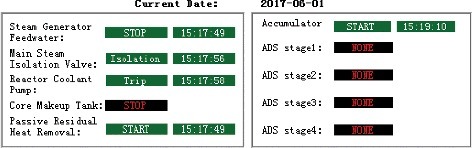
Figure 17. Safety system status for scenario 1.
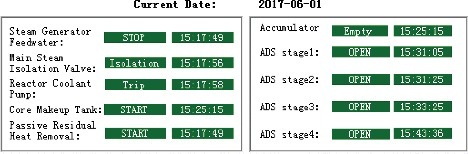
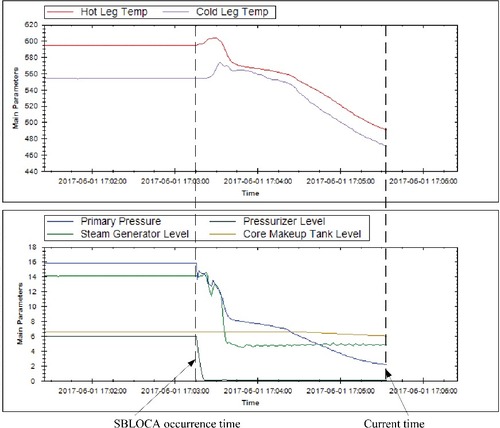
Figure 18. Main parameters trends.