Figures & data
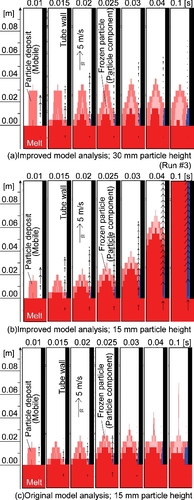
Figure 1. Schematic view of a core fuel subassembly during CDAs.
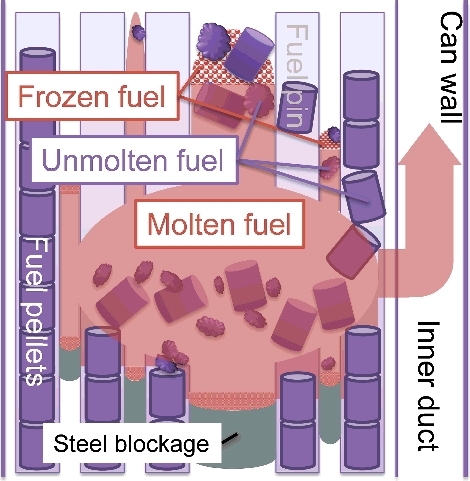
Table 1. Validation status of the key models for blockage formation of the solid–liquid mixture flow with freezing
Table 2. Fuel components during CDAs and modeled components in the SIMMER code with their simulants in the THEFIS experiment
Figure 2. Change in the particle viscosity factor f against the particle fraction αp for k = 5.0, αMP = 0.62, and F = 0.
Table 3. Formulation of the particle viscosity factor for each binary component
Figure 3. Physical phenomena involved in the freezing and blockage formation during CDAs.
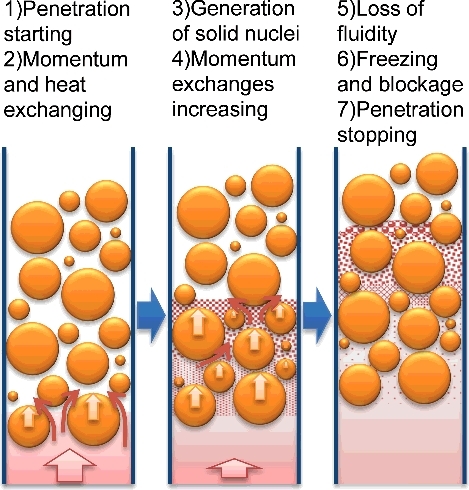
Table 4. Improved formulation of the particle viscosity factor for each binary component
Figure 4. Experimental system and analytical model.
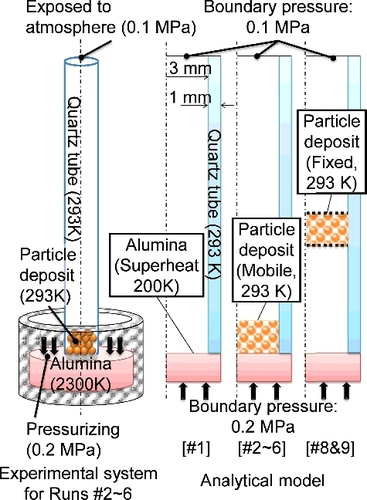
Table 5. Position and height of the particle deposit, and computational mesh size for each case
Figure 5. Relation of the phenomena involved in each run of the THEFIS experiment.
Figure 6. Results of penetration length obtained by the THEFIS experiment [Citation12] and the SIMMER analysis for various computational-mesh sizes for (a) Run #8 and (b) Run #9.
![Figure 6. Results of penetration length obtained by the THEFIS experiment [Citation12] and the SIMMER analysis for various computational-mesh sizes for (a) Run #8 and (b) Run #9.](/cms/asset/bc774378-a60d-42a7-9ce2-de3b536fbe84/tnst_a_1417172_f0006_b.gif)
Figure 7. Axial distribution of materials with the melt velocity vector during melt penetration around the particle deposit for the Run #8 analysis with the computational mesh of 4 mm (the vertical axis shows the distance from the lower-end of the tube).
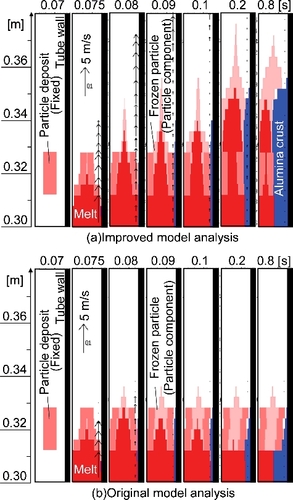
Figure 8. Results of penetration length for Runs #1–#6 obtained by the THEFIS experiment [Citation12] and the SIMMER analysis for various computational-mesh sizes.
![Figure 8. Results of penetration length for Runs #1–#6 obtained by the THEFIS experiment [Citation12] and the SIMMER analysis for various computational-mesh sizes.](/cms/asset/129adcb1-3d68-4344-b658-3588dc224eed/tnst_a_1417172_f0008_b.gif)
Figure 9. Axial distribution of materials with the melt velocity vector at the beginning of melt penetration for particle height of 30 and 15 mm with computational mesh of 5 mm.