Figures & data
Table 1. Constitutive equations implemented in TRAC-BF1 code
Figure 1. Void fraction covariance and relative velocity covariance calculated by Ozaki and Hibiki [Citation17] model at a pressure of 7 MPa.
![Figure 1. Void fraction covariance and relative velocity covariance calculated by Ozaki and Hibiki [Citation17] model at a pressure of 7 MPa.](/cms/asset/fba00924-7271-4f1f-953f-71fc67c5cf2f/tnst_a_1432425_f0001_b.gif)
Figure 2. Calculation model and nodalization of TRAC-BF1 for rod bundle under two-phase flow (steady-state simulation case).
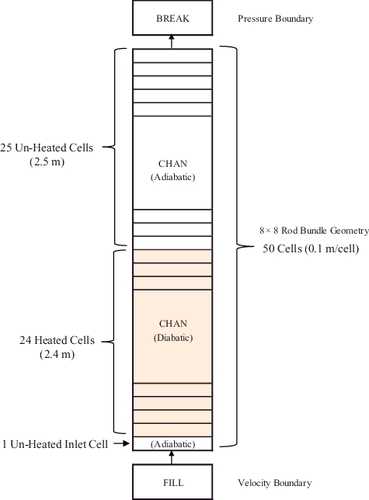
Table 2. Boundary conditions of inlet flow rate, outlet pressure and bundle power conditions for steady-state simulations
Figure 3. Comparisons of axial void fraction profiles for steady-state simulation cases at targeted void fraction of 0.8 and mass flow rate of (a) 5, (b) 10, and (c) 15 kg/s.
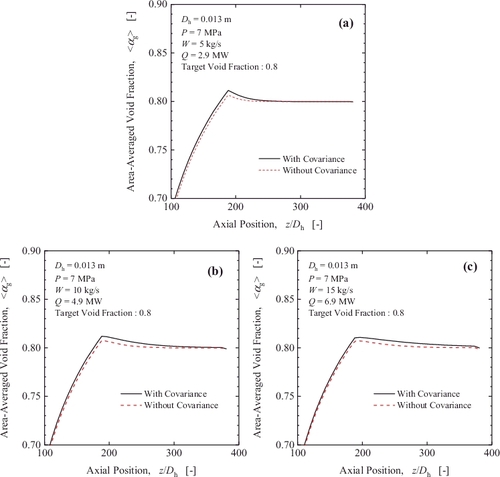
Figure 4. Comparisons of the void fraction at (a) 26th cell, (b) 35th cell, (c) 40th cell, and (d) 45th cell from the inlet of CHAN component with the conditions of mass flux.
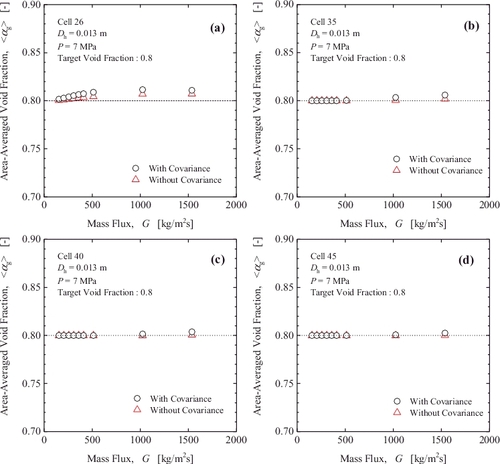
Figure 5. Calculation model and nodalization of TRAC-BF1 for rod bundle under two-phase flow (transient simulation case).
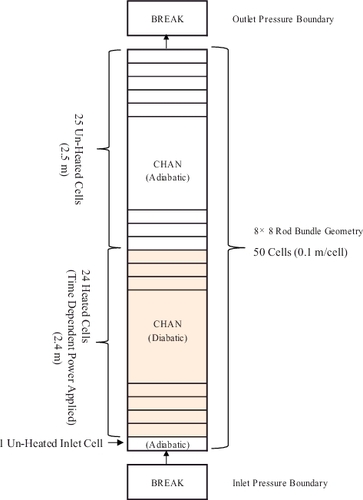
Table 3. Pressure boundary conditions and initial power and void fraction conditions for transient simulations
Figure 6. Bundle power perturbation applied for transient simulation case.
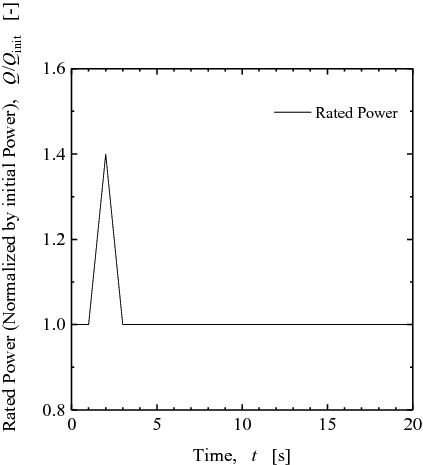
Figure 7. Comparison of area-averaged void fraction trend at the 45th cell from the inlet of CHAN component.
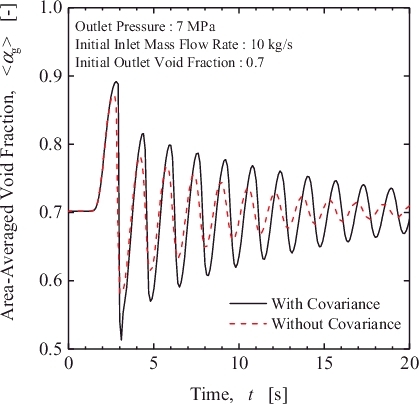
Figure 8. Comparison of inlet flow rate of CHAN component.
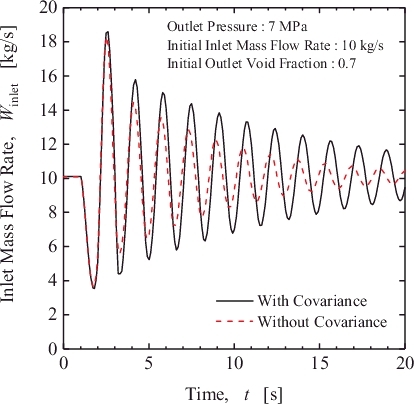
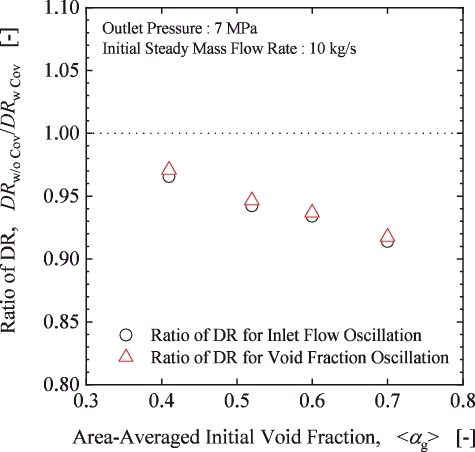
Figure 9. Comparisons of dumping ratio for inlet flow rate and void fraction oscillation.