
Figures & data
Figure 1. Total cross section of neutron production by p–Be. Dots are the available experimental data [Citation18,Citation19]. The solid line was obtained using the function.
![Figure 1. Total cross section of neutron production by p–Be. Dots are the available experimental data [Citation18,Citation19]. The solid line was obtained using the function.](/cms/asset/15605058-d0e4-4f2b-bc61-ab01e7b20870/tnst_a_1445566_f0001_oc.jpg)
Figure 2. Angular distribution. Dots are the available experimental data [Citation7,Citation20–22]. The solid line was obtained using the function.
![Figure 2. Angular distribution. Dots are the available experimental data [Citation7,Citation20–22]. The solid line was obtained using the function.](/cms/asset/7fac2d69-87be-43f3-9c4d-0bab0e34d833/tnst_a_1445566_f0002_oc.jpg)
Figure 3. Energy spectrum. Dots are the available experimental data [Citation21]. The solid line was obtained using the function.
![Figure 3. Energy spectrum. Dots are the available experimental data [Citation21]. The solid line was obtained using the function.](/cms/asset/4409b667-8fe0-47b9-acd1-43759f2cc1ca/tnst_a_1445566_f0003_oc.jpg)
Figure 4. Results of the calculation using our function for the neutron energy spectra at angles of 0°, 20°, 40°, 60°, 80°, 110°, and 140° under the condition of Ep = 4 MeV with a 0.5-mm-thick Be target. Solid lines are the calculations using the FS. Dots are existing data [Citation23].
![Figure 4. Results of the calculation using our function for the neutron energy spectra at angles of 0°, 20°, 40°, 60°, 80°, 110°, and 140° under the condition of Ep = 4 MeV with a 0.5-mm-thick Be target. Solid lines are the calculations using the FS. Dots are existing data [Citation23].](/cms/asset/918118bb-5631-41d5-bebe-dfe5b7a24b8f/tnst_a_1445566_f0004_b.gif)
Figure 5. Results of the calculation using our function for the neutron energy spectra at angles of 0°, 20°, 40°, 60°, 80°, 110°, and 140° under the condition of Ep = 4 MeV with a 0.5-mm-thick Be target. The thick solid lines show the calculations with the function. Dots are existing data [Citation23]. Dashed lines were obtained using ENDF/B-VII.0. Thin solid lines were obtained using JENDL4.0/HE.
![Figure 5. Results of the calculation using our function for the neutron energy spectra at angles of 0°, 20°, 40°, 60°, 80°, 110°, and 140° under the condition of Ep = 4 MeV with a 0.5-mm-thick Be target. The thick solid lines show the calculations with the function. Dots are existing data [Citation23]. Dashed lines were obtained using ENDF/B-VII.0. Thin solid lines were obtained using JENDL4.0/HE.](/cms/asset/9f0adffa-7e7f-4a01-a1cf-d3e1c51f6299/tnst_a_1445566_f0005_oc.jpg)
Figure 6. Results of the calculations using our function, ENDF/B-VII.0, and JENDL4.0/HE for neutron energy spectra at angles of 0°, 15°, 30°, 60°, 90°, and 120° under the condition of Ep = 12 MeV with a 2-mm-thick Be target. Solid lines show the calculations using the function. Dots are recent experimental data [Citation8]. Dashed lines were obtained using ENDF/B-VII.0. Thin solid lines were obtained using JENDL4.0/HE.
![Figure 6. Results of the calculations using our function, ENDF/B-VII.0, and JENDL4.0/HE for neutron energy spectra at angles of 0°, 15°, 30°, 60°, 90°, and 120° under the condition of Ep = 12 MeV with a 2-mm-thick Be target. Solid lines show the calculations using the function. Dots are recent experimental data [Citation8]. Dashed lines were obtained using ENDF/B-VII.0. Thin solid lines were obtained using JENDL4.0/HE.](/cms/asset/c1d52e67-b21c-4964-9a0f-b9d0b5b00e75/tnst_a_1445566_f0006_oc.jpg)
Figure 7. Schematic cross-sectional view of RANS downstream of the proton accelerator and enlarged view around the Be target.
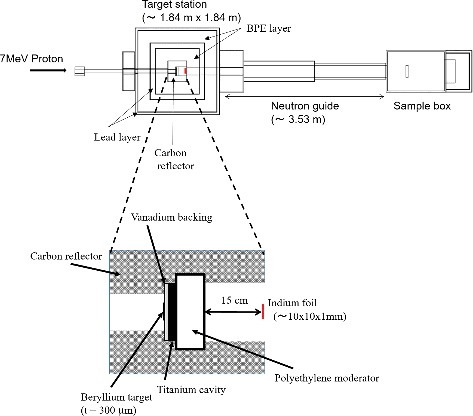
Table 1. Comparison of the reaction rate of In5n. The C/E ratio is the calculated result divided by the experimental value
Figure 8. Neutron flux spectra at a distance of 5 m from the moderator. The thick solid line indicates the spectrum obtained using the source neutron of CF. The thin solid line shows that obtained using our original source neutron [Citation16,Citation17]. The dotted line indicates the cross section of the 115In(n,n’)115mIn reaction.
![Figure 8. Neutron flux spectra at a distance of 5 m from the moderator. The thick solid line indicates the spectrum obtained using the source neutron of CF. The thin solid line shows that obtained using our original source neutron [Citation16,Citation17]. The dotted line indicates the cross section of the 115In(n,n’)115mIn reaction.](/cms/asset/7122e064-265a-4a41-b0b7-64aee675a00d/tnst_a_1445566_f0008_oc.jpg)